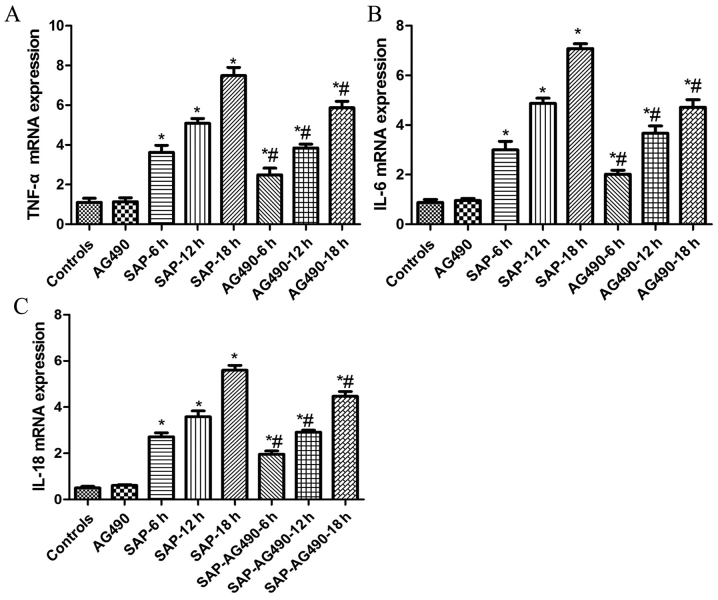
Figure 1.
Expression of TNF-α, IL-6 and IL-18 in liver tissues. (A) TNF-α; (B) IL-6; and (C) IL-18. No difference was observed between the control and AG490 groups (P>0.05). As demonstrated in SAP groups at each time point, the levels of TNF-α, IL-6 and IL-18 were significantly increased compared with the control and AG490 groups, respectively, and were significantly down regulated by AG490 (P<0.05). P>0.05 control vs. AG490 groups; *P<0.05 vs. control groups; #P<0.05 vs. SAP groups at each time point. SAP, severe acute pancreatitis.

