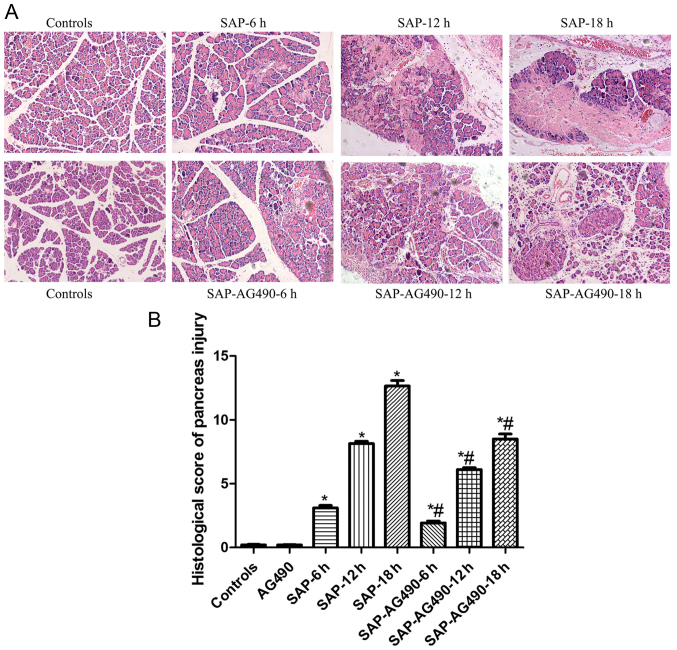
Figure 2.
Histopathological changes of the pancreas in rats from each group (magnification, ×200). (A) Representative H&E staining images of pancreatic tissues from each group of rats. (B) Histological score of pancreas injury. Pancreas of Control and AG490 groups showed normal structure. All SAP groups had pancreatic edema, inflammatory cell infiltration, fat necrosis and extensive hemorrhaging which increased gradually and became more serious at the 12 and 18 h time points. Both SAP-AG490 treatment rat edema and necrosis was significantly reduced compared with the SAP groups at each time point. P>0.05 control vs. AG490 groups; *P<0.05 vs. control groups; #P<0.05 vs. SAP groups at each time point. SAP, severe acute pancreatitis; H&E, hematoxylin-eosin.

