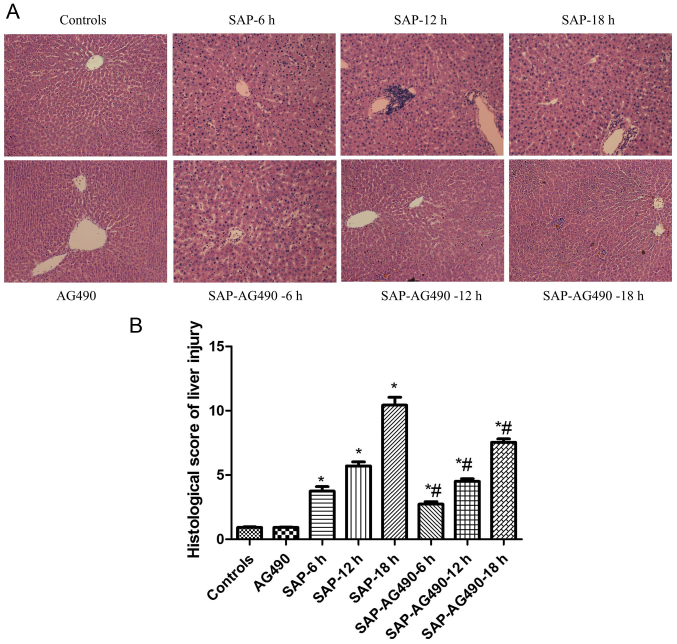
Figure 3.
Histopathological changes in the livers of rats from each group (magnification, ×200). (A) Representative H&E staining images of liver tissues from each group of rats. (B) Histological score of liver injury. The structure of liver tissue was clear and showed normal architecture in the control and AG490 groups, while the bridging necrosis and loosened cytoplasm showed in all SAP groups. SAP-AG490 treatment groups showed significantly reduced periportal and lobular inflammatory infiltration. P>0.05 control vs. AG490 groups; *P<0.05 vs. control groups; #P<0.05 for multiple comparisons of SAP and treatment groups at each time point. SAP, severe acute pancreatitis; H&E, hematoxylin-eosin.

