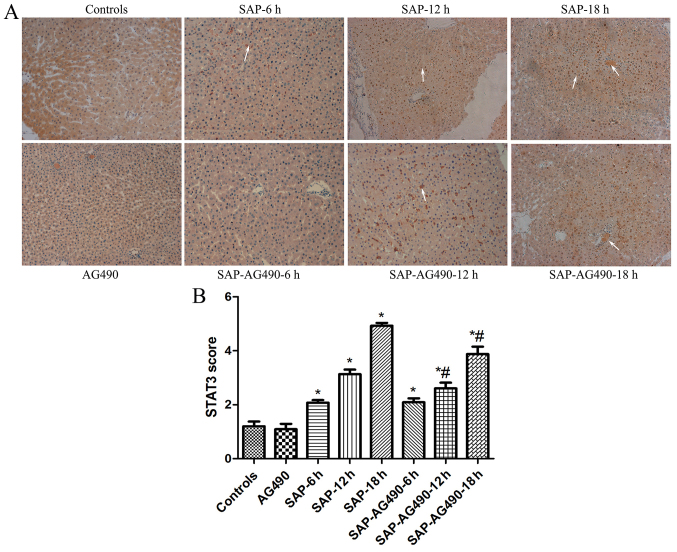
Figure 5.
Immunohistochemical localization of STAT3 in the liver tissues (magnification, ×200). (A) Immunohistochemical analysis of STAT3 expression in liver tissues from each group. (B) Graphical analysis of STAT3 expression in each group. The arrows indicated STAT3 expressed in the nucleus. In the control groups, the expression of STAT3 was weakly observed in the nucleus. In SAP groups, intense positive staining of STAT3 increased markedly at 6, 12 and 18 h time points. AG490-treated liver tissues showed a reduction of STAT3 in the nucleus. P>0.05 control vs. AG490 groups; *P<0.05 vs. control groups; #P<0.05 vs. SAP groups at each time point. SAP, severe acute pancreatitis; STAT, signal transducers and activators of transcription.

