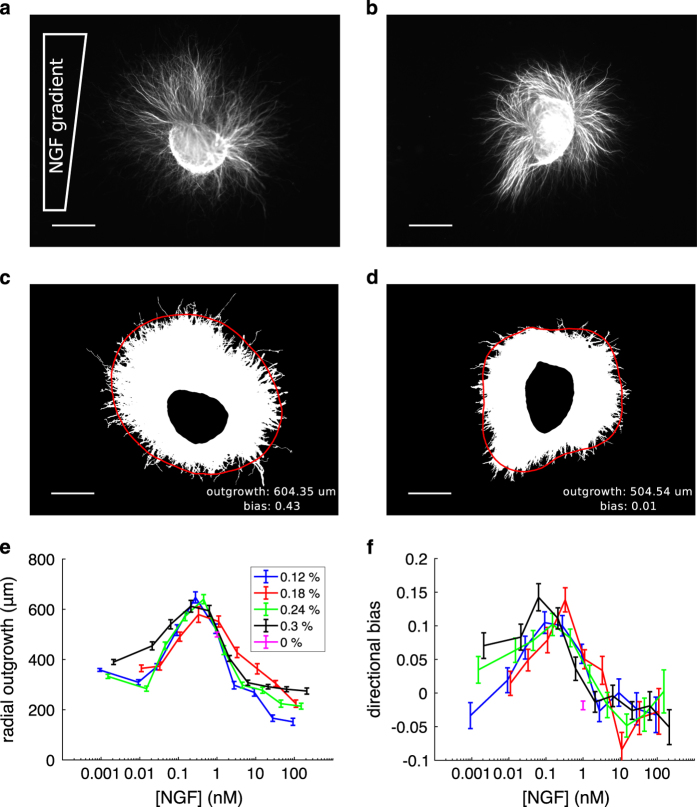
(
a,
b) Raw images of DRG explants (filenames ‘
27_0806d_0p2_003p000.tif
’ and ‘
24_2506d_0p3_003p000.tif
’ for
a and
b, respectively). The NGF gradient increases towards the top of the image. Scale bars 500 um. (
c,
d) Binary masks for the neurite regions of the images directly above. Superimposed is the Fourier approximation of radial outgrowth using five coefficients (red curve), and the outgrowth and bias measurements (text; lower right). Scale bars 500 um. (
e) Quantification of average radial outgrowth by Fourier coefficient
a0 as a function of background concentration (x-axis) and gradient steepness (colours; see legend). (
f) Quantification of outgrowth bias up the gradient by normalised coefficient
b1/
a0 Error bars are SEM.

