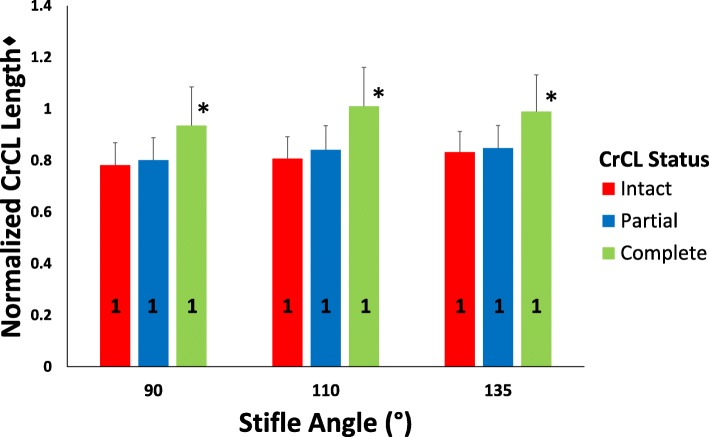
Fig. 4.
Bar graph of mean ± SD normalized CrCL length values as CrCL status sequentially changes at each stifle angle. Univariate ANOVA test performed to assess for differences in normalized mean CrCL length as CrCL status changes. Presence of an asterisk (*) indicates a significant difference (P < 0.05) between CrCL length values within a single stifle angle group. Presence of a different numeral (1, 2, or 3) on a bar indicates a difference between stifle angle groups within a single CrCL status. ♦The CrCL length measurements were normalized using the length of the medial tibial condyle

