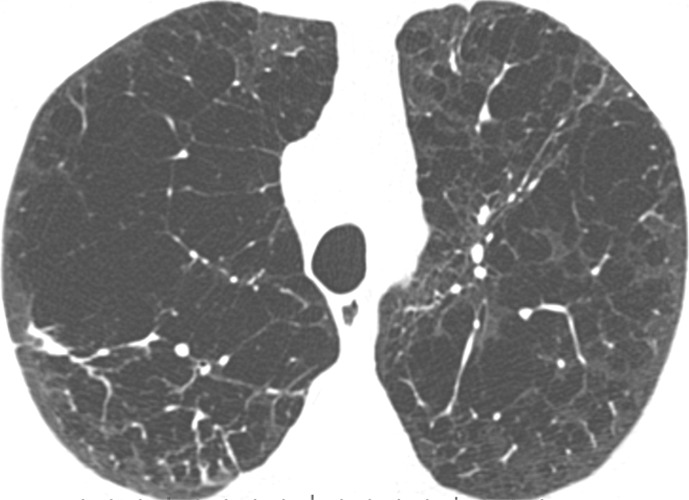
Figure 1f:

Axial CT images show severity grades of parenchymal emphysema. (a) Normal CT scan shows no emphysema. (b) Image shows trace centrilobular emphysema (circle), which involved less than 0.5% of the lung zone. (c) Image shows mild centrilobular emphysema (arrows), which involved 0.5%–5.0% of the lung zone. (d) Image shows moderate centrilobular emphysema, which involved more than 5% of the lung zone. (e) Confluent emphysema. (f) Advanced destructive emphysema with vascular distortion.
