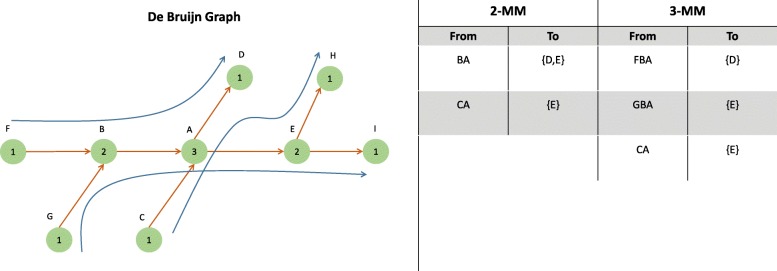
Fig. 1.
This figure shows the association between the de Bruijn graph and MM tables. On the left side, part of a de Bruijn graph is shown. True paths are depicted by blue lines. The numbers inside each node indicate the multiplicity of that node, i.e., the number of times the node’s sequence is present in the reference genome. A table at each node guides the aligner based on previously observed nodes. The 2-MM and 3-MM tables of node A are shown on the right side. Based on the 2-MM table, reads that align to CA are guided to E as the continuation to node D is not allowed. However, the information in this table is insufficient to guide reads that align to BA since continuations to E and D are both valid. In contrast, the 3-MM table guides the reads that align to FBA to D, and GBA to E. The information in the final row in 3-MM table is redundant because it is also contained in the lower-order 2-MM table

