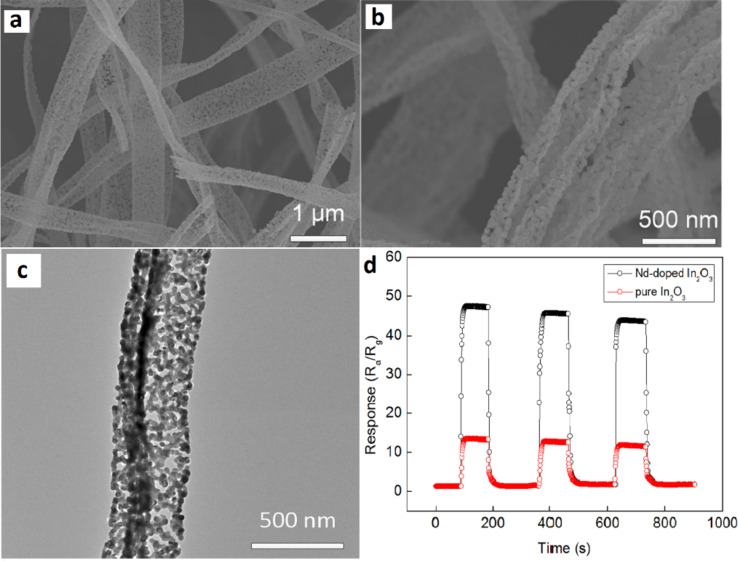
Figure 10.
SEM images of (a) pure In2O3 porous NTs; (b) Nd-doped In2O3; (c) TEM image of Nd-doped In2O3 porous NTs; (d) response and recovery curves of pure and Nd-doped In2O3 porous nanotube sensors to 100 ppm formaldehyde at 240 °C. Reproduced with permission from [211], copyright 2016 Springer.

