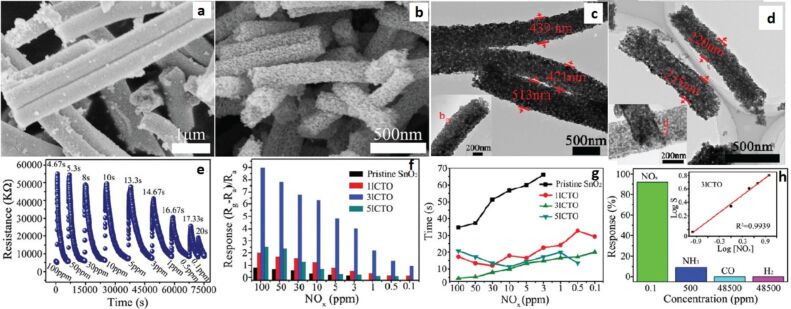
Figure 11.
SEM images of (a) pristine SnO2 and (b) 3ICTO; TEM images of (c) pristine SnO2 NRs; (d) 3ICTO NRs; (e) dynamic response–recovery curves of the 3ICTO sensor for 100 ppm–0.1 ppm NOx at RT; (f) gas response and (g) response time for the four samples; (h) response of the 3ICTO sensor to different gases, the inset shows a linear dependence relation between the logarithm of the response and concentration of NOx. Reproduced with permission from [227], copyright 2015 Royal Society of Chemistry.

