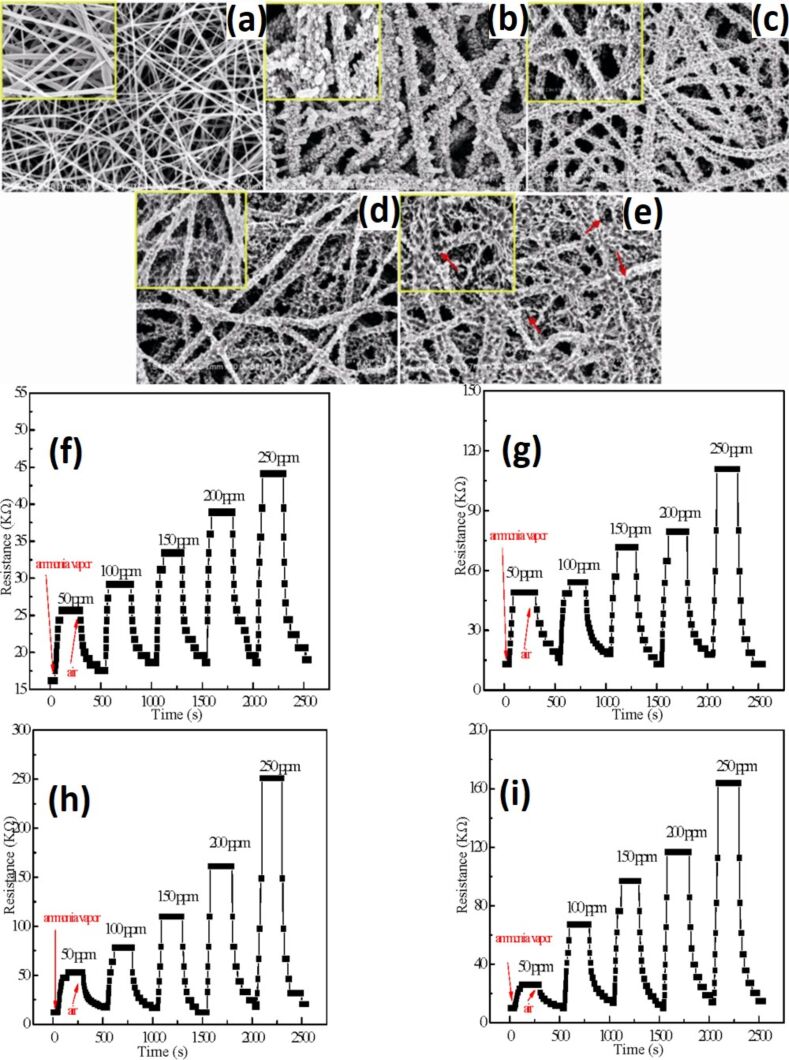
Figure 15.
SEM image of (a) PA6 NFs; (b) PANI/PA6 NFs; (c) PANI/PA6 NFs sputtered for 30 min; (d) TiO2–PANI/PA6 NFs sputtered for 60 min; (e) TiO2–PANI/PA6 NFs sputtered for 90 min; dynamic response and recovery of (f) PANI/PA6; (g) TiO2–PANI/PA6 sputtered for 30 min; (h) TiO2–PANI/PA6 sputtered for 60 min and (i) TiO2–PANI/PA6 sputtered for 90 min to ammonia vapour of different concentrations. Reproduced with permission from [238], copyright 2012 MDPI.

