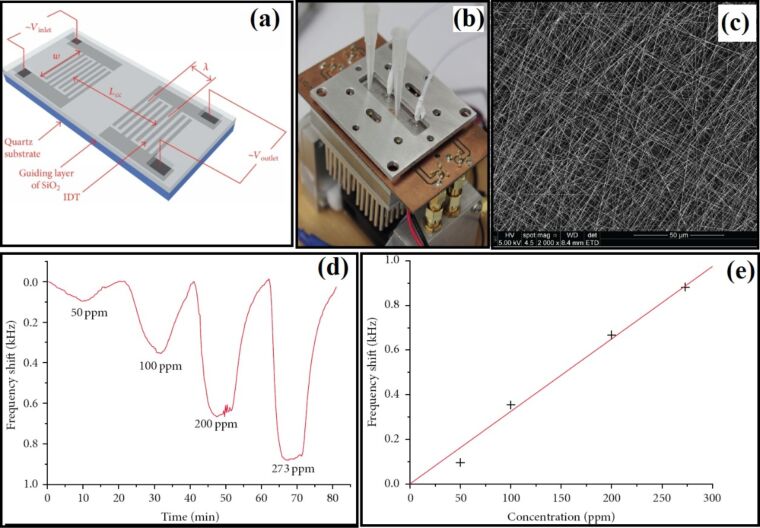
Figure 18.
(a) 3D scheme representation; (b) real experimental setup of a Love-wave sensor with two RF ports, layer composition, and geometrical parameters; (c) SEM images of SAW resonators deposited with electrospun PVP nanofiber; (d) dynamic frequency shift of the SAW sensor with a sensitive layer of electrospun PVP nanofibers for different concentrations of toluene and (e) the linear relation between frequency shift and the concentration [250]. Images reproduced from [250], copyright 2017 Matatagui et al.

