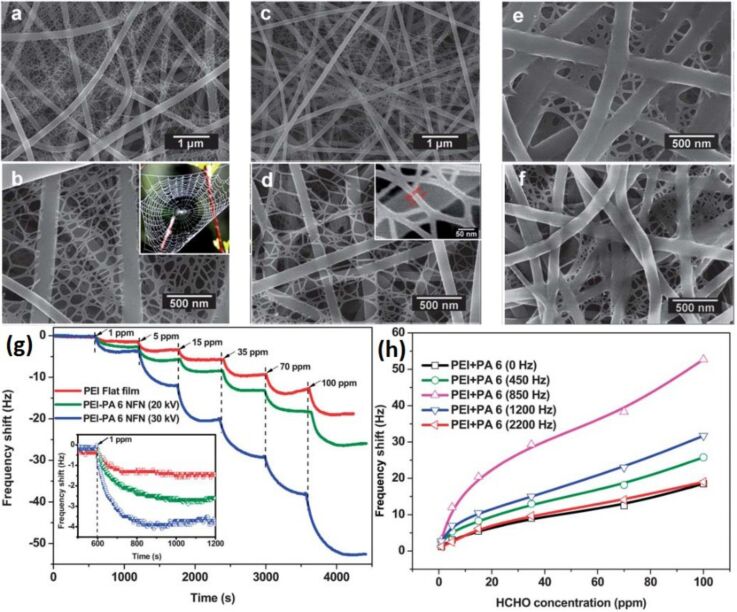
Figure 19.
FE-SEM images of PA 6 NFN membranes formed with different voltages: (a, b) 20 kV and (c, d) 30 kV; and their corresponding samples modified with PEI: (e) PEI-PA 6 (20 kV) and (f) PEI-PA 6 (30 kV). Inset of (b) shows the optical image of the spider-web morphology. (g) Dynamic response of QCM sensors coated with three different sensing structures upon exposure to increased formaldehyde concentrations. The inset is the amplified image for 1 ppm formaldehyde detection; (h) dependence of frequency shift for QCM-based PEI-PA 6 NFN (30 kV) sensors with various PA 6 coating loadings on formaldehyde concentration (1–100 ppm). Reproduced with permission from [258], copyright 2011 Royal Society of Chemistry.

