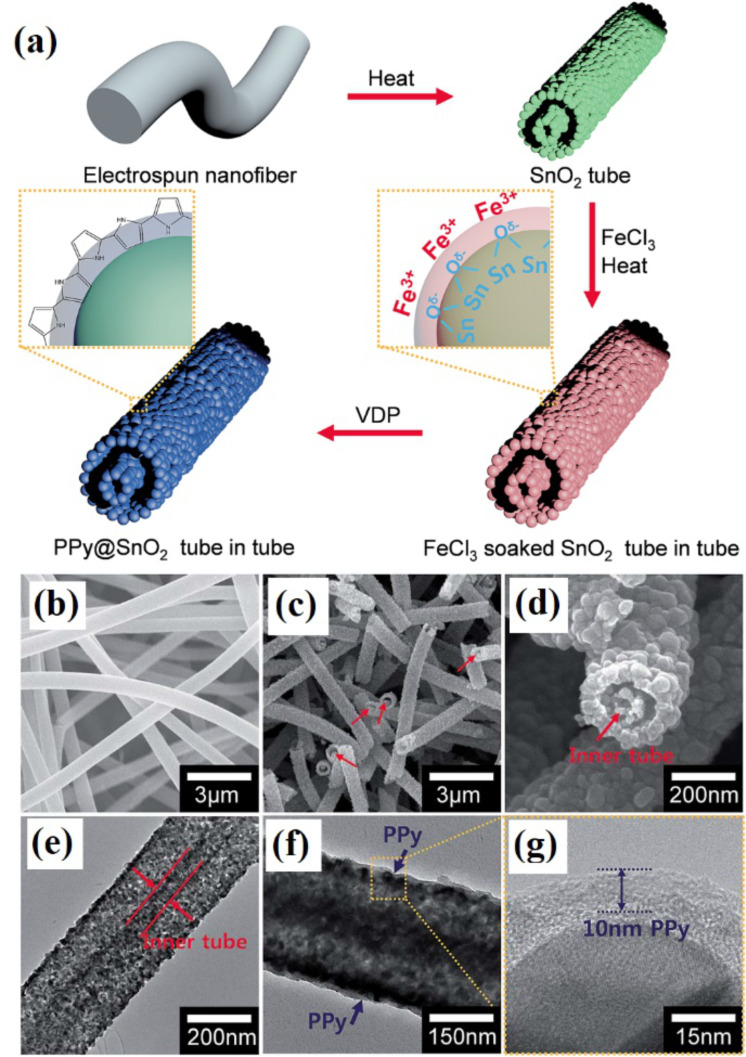
Figure 7.
(a) Schematic diagram of the sequential fabrication of a PPy@SnO2 tube-in-tube structure. (b) FE-SEM image of the electrospun nanofibers. (c, d) Low- and high-resolution FE-SEM images of the tube-in-tube SnO2. (e) Low-resolution TEM images of the tube-in-tube SnO2. (f, g) Low- and high-resolution TEM images of the tube-in-tube PPy/SnO2. Reproduced with permission from [77], copyright 2017 Royal Society of Chemistry.

