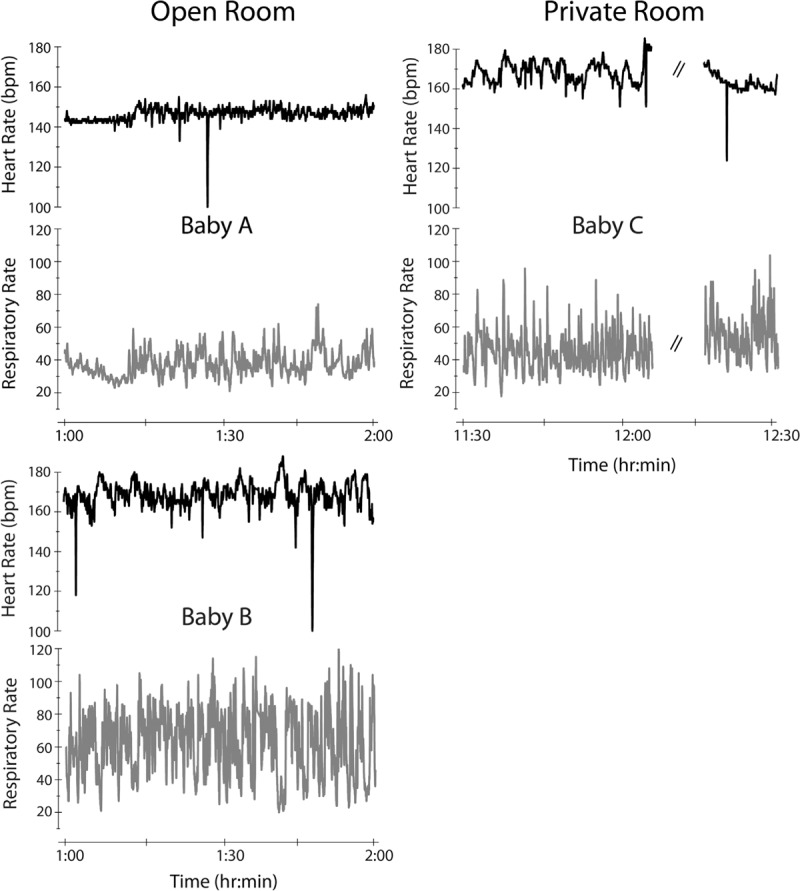
Figure 3.

The intersubject variability of infant heart and respiratory rate is shown. Each panel displays 1 h of the total recording of the heart rate (black) and respiratory rate (gray) with a 1-s resolution for each infant. Babies A and B (left) were in the open room environment while Baby C (right) was in the private room environment. Note that while Babies A and B were in the same acoustic environment, the heart and respiratory rate were more variable in Baby B. Dashed lines indicate extraction of physiologic data during infant handling.
