Figure 3.
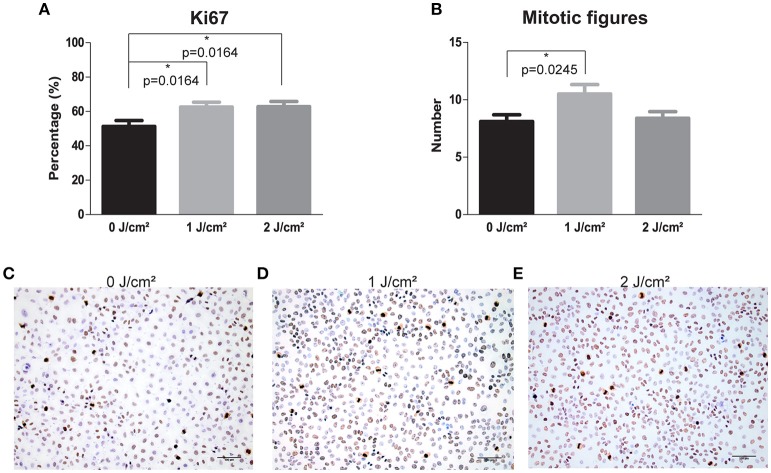
LLLT induces proliferation via increase of Ki67 levels and mitotic figures in HNSCC SQD9 cell line. (A) The percentage of Ki67 staining in SQD9 cells after irradiation with energy densities of 0, 1 and 2 J/cm2. (B) The number of mitotic figures present in SQD9 cells after irradiation with energy densities of 0, 1, and 2 J/cm2. (C) Ki67 and mitotic figure staining in SQD9 cells after irradiation with an energy density of 0 J/cm2. (D) Ki67 and mitotic figure staining in SQD9 cells after irradiation with an energy density of 1 J/cm2. (E) Ki67 and mitotic figure staining in SQD9 cells after irradiation with an energy density of 2 J/cm2. (A,B) Scoring of Ki67 staining (RM-9106-R7, Thermo Scientific) and mitotic figures was performed in 10 fields with a magnification of 200X by 2 independent observers. *p-values < 0.05 were calculated by a two-tailed t-test. Scale bar = 100 μm.

