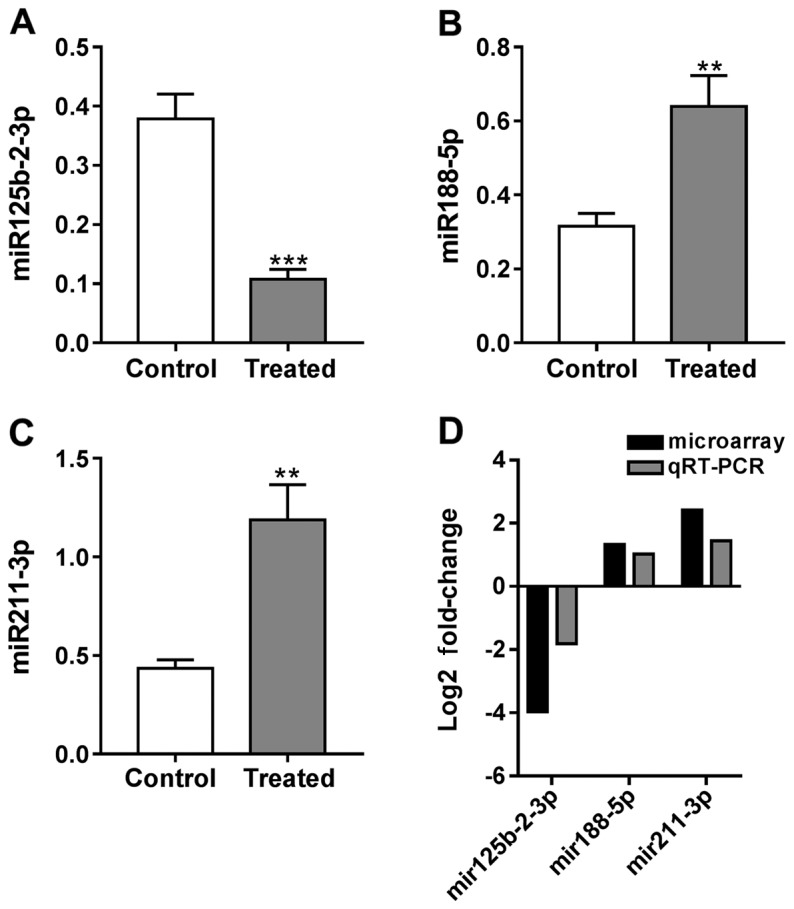
Figure 3.

Expression of (A) rho-miR125b-2-3p, (B) rho-miR88-5p and (C) rho-mir211-3p by RT-qPCR analysis. (D) Comparison of microarray and RT-qPCR results of selected DEMs. RT-qPCR, reverse transcription-quantitative polymerase chain reaction; DEMs, differentially expressed miRNAs. Compared with control, **P<0.01; Compared with control, ***P<0.001.
