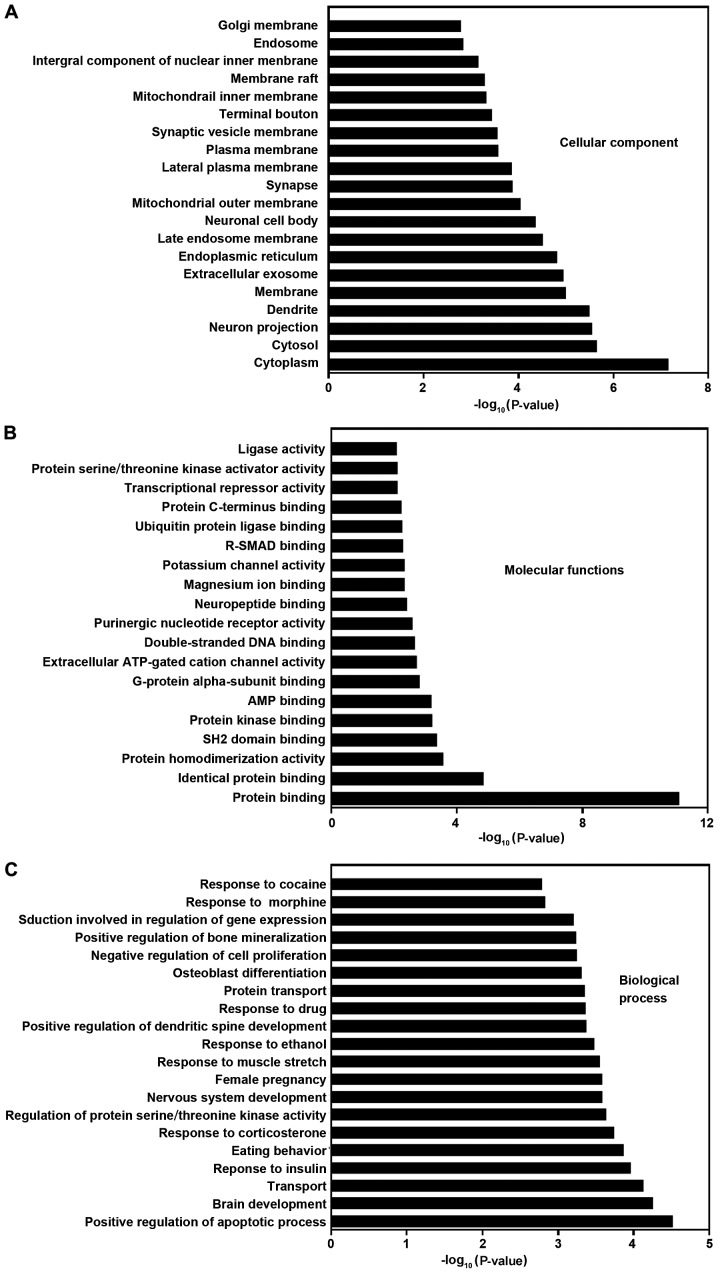
Figure 5.
GO analysis based on miRNA-targeted genes. (A) Cellular component. (B) Molecular function. (C) Biological process. The histograms of significant pathways targeted by DEMs are shown. The vertical axis is the pathway category, and the horizontal axis represents -log (P-value) of the pathways. GO, Gene Ontology; miRNA, microRNA; DEMs, differentially expressed miRNAs.

