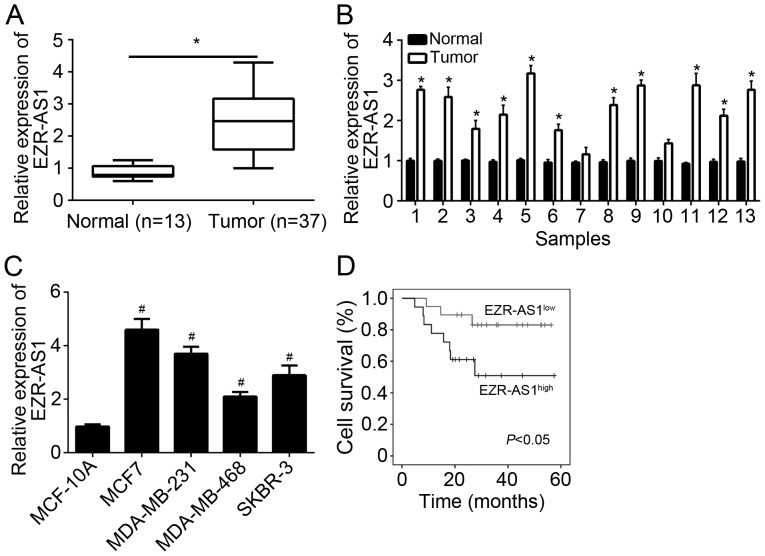
Figure 1.
EZR-AS1 was upregulated in BC tissues. Relative expression of EZR-AS1 in (A) 37 BC tissues and 13 adjacent normal tissues, (B) 13 pairs of BC and adjacent normal tissues and (C) BC cell lines and normal MCF-10A cells. (D) A Kaplan-Meier curve was constructed based on EZR-AS1 expression in BC tissues. *P<0.05 vs. normal and #P<0.05 vs. MCF-10A. All data are presented as the mean ± standard deviation of three independent experiments. BC, breast cancer; RT-qPCR, reverse transcription-quantitative polymerase chain reaction.

