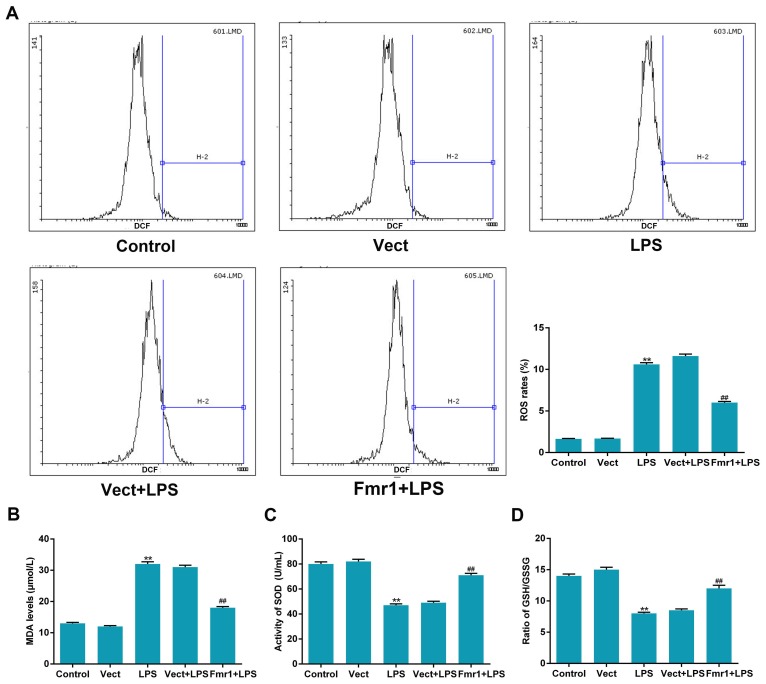
Figure 2.
Fmr1 overexpression alleviates oxidative stress induced by LPS in H9c2 cells. (A) A dichloro-dihydro-fluorescein diacetate assay and flow cytometry were applied to detect ROS levels in the Fmr1+LPS group, Vect+LPS group, Vect group, LPS group and Control group. (B) The content of the lipid peroxidation product MDA, (C) the activity of SOD and (D) the ratio of GSH/GSSG were also detected in these 5 cell groups. Values are expressed as the mean ± standard deviation (n=5 per group). **P<0.01 vs. control; ##P<0.01 vs. Vect+LPS control. LPS, lipopolysaccharide; Vect, empty vector; fmr1, fragile X mental retardation 1; ROS, reactive oxygen species; MDA, malondialdehyde; SOD, superoxide dismutase; GSH/GSSG, reduced vs. oxidized glutathione.

