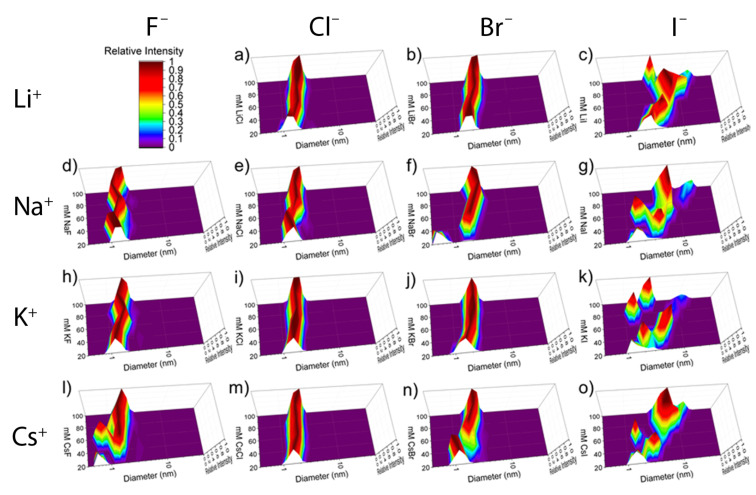
Figure 3.
Representative plots of the volume-weighted distribution obtained by DLS for salts titrated into 2.00 mM 2: a) LiCl, b) LiBr, c) LiI, d) NaF, e) NaCl, f) NaBr, g) NaI, h) KF, i) KCl, j) KBr, k) KI, l) CsF, m) CsCl, n) CsBr, o) CsI. Scale shown in the upper left corner. The x-axis represents hydrodynamic diameter, the y-axis the concentration of the respective salt (mM), and the z-axis the relative intensity.

