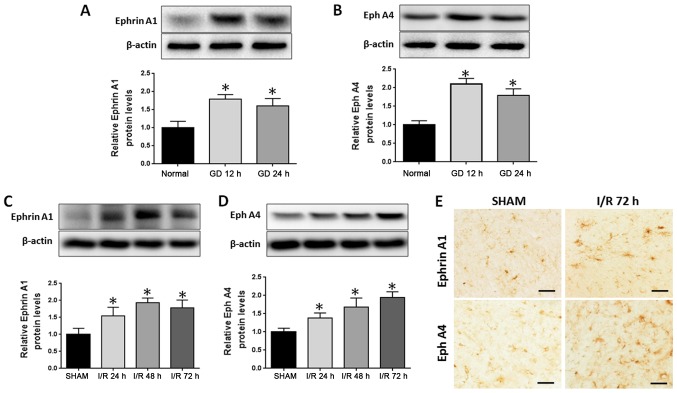
Figure 1.
Expression level of EphrinA1 and EphA4 following ischemic stroke in vitro and in vivo. Expression levels of (A) EphrinA1 and (B) EphA4 in human brain microvascular endothelial cells exposed to GD conditions for 12 and 24 h, as determined via western blot analysis. Expression levels of (C) EphrinA1 and (D) EphA4 in ipsilateral cortical tissue following cerebral ischemia for 24, 48 and 72 h, as determined via western blot analysis. (E) Representative micrographs of EphrinA1 and EphA4 in the cortex in different groups. Scale bar, 50 µm. Each data point represents the mean ± standard error of the mean; n=10, *P<0.05 vs. the sham group. I/R, ischemia-reperfusion.

