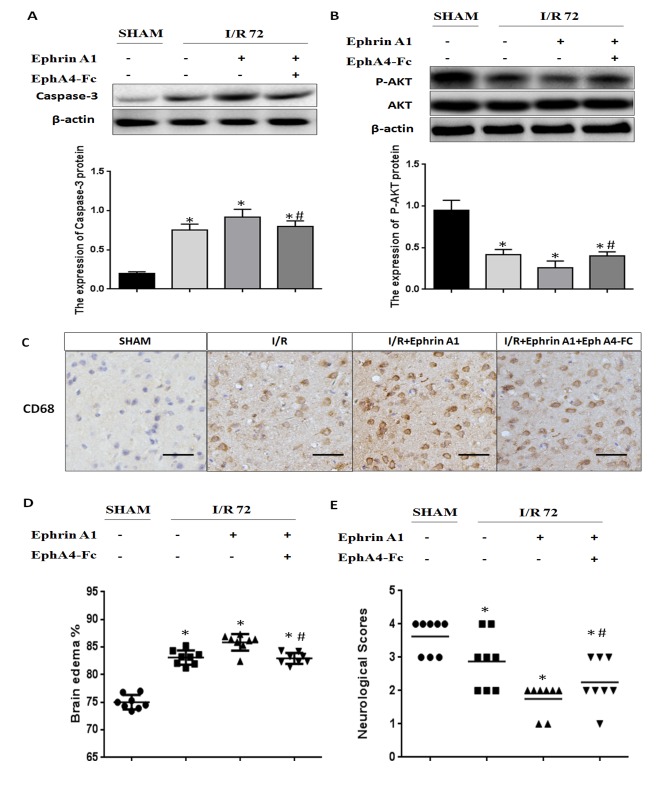
Figure 3.
EphA4 activation by EphrinA1 enhances brain injury associated with increased apoptotic death, inflammatory infiltrates and brain edema, and lower functional outcomes. Western blot analysis reveals the expression of (A) caspase-3 and (B) P-AKT in the cortex. Bars represent the relative density against β-actin. (C) The expression levels of CD68 were determined by immunostaining in the cortex in the different groups. (D) Quantitative measurement of brain edema in the ipsilateral brain hemisphere using the wet-dry method. (E) Neurological scores of animals in the different groups. Scale bar, 50 µm. Each data point represents the mean ± standard error of the mean; n=10, *P<0.05 vs. sham group. #P<0.05 vs. I/R+EphrinA1 group. P-AKT, phosphorylated-protein kinase B; CD, cluster of differentiation; I/R, ischemia-reperfusion.

