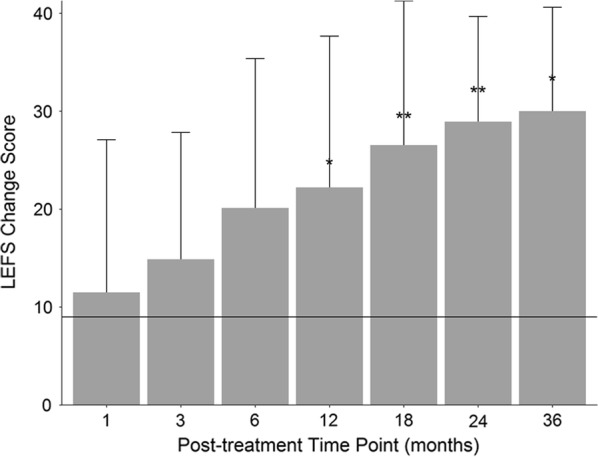
Fig. 4.

Mean LEFS change score at every post-treatment time-point. Scores were significantly higher than baseline at all time-points. MCID = 9 which is represented by horizontal line. *p < 0.05 compared to 1-month scores; **p < 0.05 compared to 1- and 3-month scores. Number of patients reporting at each time point: 1 month (N = 14); 3 month (N = 19); 6 month (N = 19); 12 month (N = 19); 18 month (N = 16); 24 month (N = 17); 36 month (N = 8)
