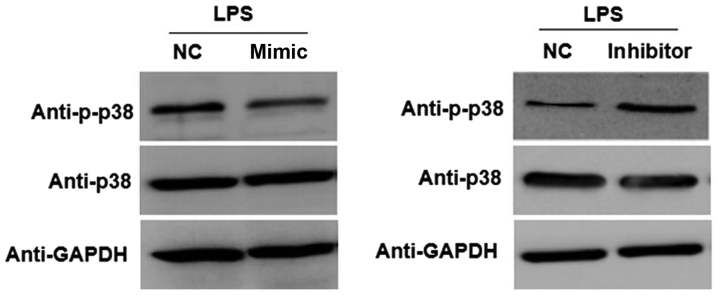
Figure 4.
Expression level of p38 and p-p38 in NP cells stimulated with LPS. NP cells were transfected with miR-148a mimic, miR-148a inhibitor or NC. At 24 h after the transfection, the cells were stimulated with LPS for 24 h. Then, western blot analysis was performed to detect protein expression levels. NC, negative control (NP cells transfected with NC oligonucleotides and stimulated with LPS); NP, nucleus pulposus; miR, microRNA; LPS, lipopolysaccharide.

