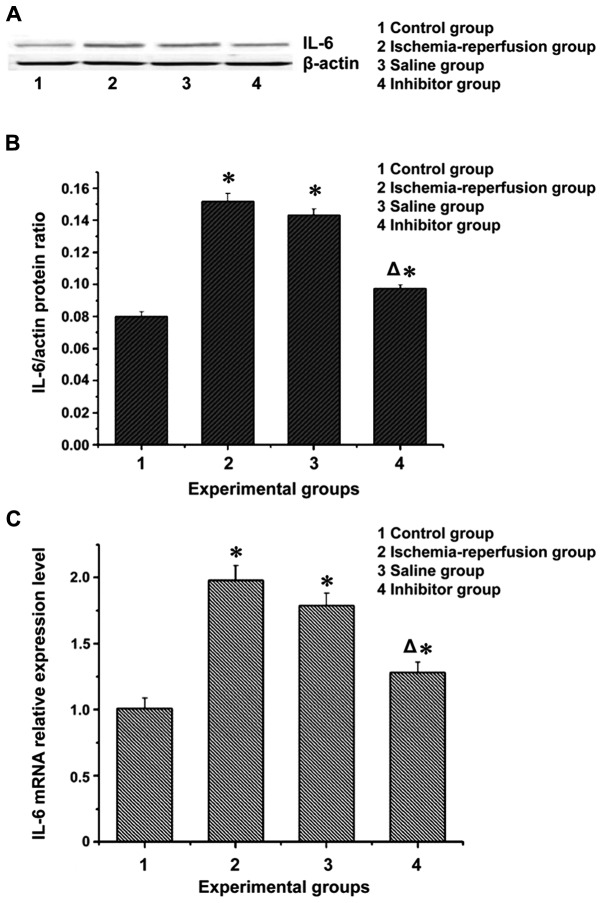
Figure 2.
The mRNA and protein expression levels of IL-6 in the flap tissues. (A) Western blotting measurement of IL-6 expression. (B) IL-6 gray value analysis. (C) RT-PCR measurement of mRNA expression of IL-6: the mRNA and protein expression levels of inflammatory factor IL-6 were much higher in the ischemia-reperfusion group and the saline group than those in the control group and the inhibitor group (P<0.05). *P<0.05, compared with the control group; ΔP<0.05, compared with the ischemia-reperfusion group and the saline group.

