Fig. 4.

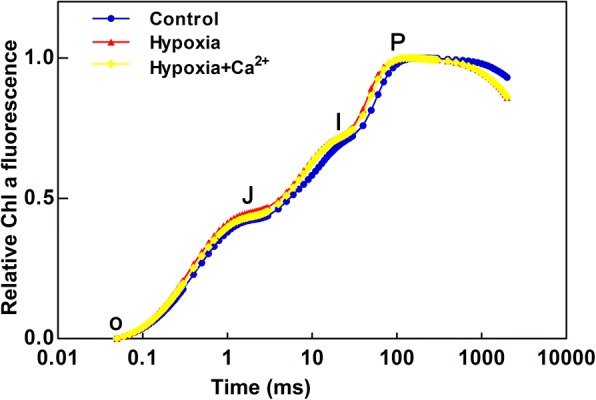
Fast chl a fluorescence transient (OJIP) plotted on logarithmic time scale (0.01–1 s) measured under normoxic conditions (Control), hypoxic treatments (Hypoxia), hypoxia + Ca2+ treatments (Hypoxia+Ca2+)

Fast chl a fluorescence transient (OJIP) plotted on logarithmic time scale (0.01–1 s) measured under normoxic conditions (Control), hypoxic treatments (Hypoxia), hypoxia + Ca2+ treatments (Hypoxia+Ca2+)