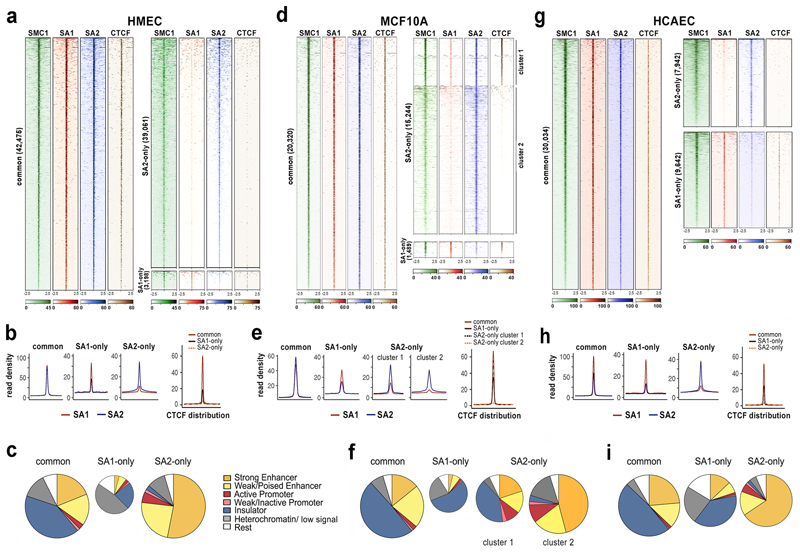
Fig. 1. A large fraction of cohesin-SA2 localizes to enhancers independently of CTCF.
a, Analysis of ChIP-seq read distribution for SA1, SA2, SMC1 and CTCF around common, cohesin SA1-only and cohesin SA2-only positions within a 5-kb window in HMECs. b, Average read density plots for SA1 (red) and SA2 (blue) distribution in common, SA1-only and SA2-only positions as well as for CTCF (separate plot on the right). c, Pie charts showing the distribution of cohesin positions in chromatin states defined in HMECs. d-f, same as a-c in MCF10A cells. g-i, same as a-c in HCAECs. CTCF datasets are from ENCODE (Supplementary Dataset 2).

