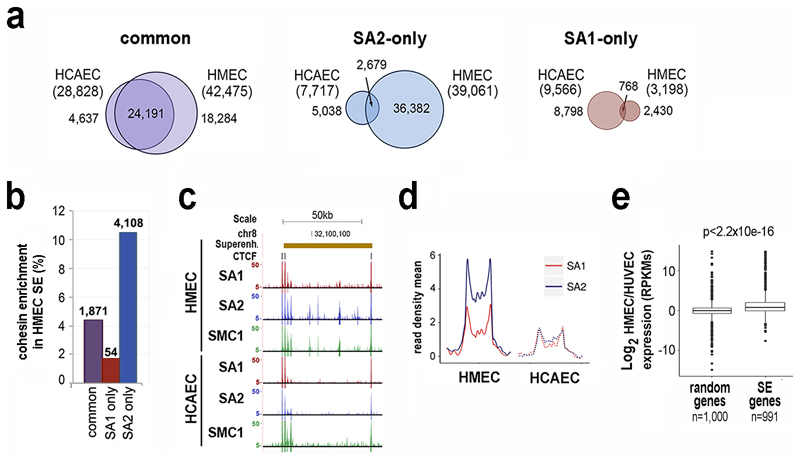
Fig. 2. Cohesin SA2-only positions are enriched in cell-type specific super-enhancers.
a, Venn diagrams showing overlap of cohesin binding sites between HMECs and HCAECs. Common positions are clearly more conserved. b, Cohesin enrichment in super-enhancers (SE) defined in HMECs. c, Example of cohesin distribution in HMEC and HCAEC cells within a HMEC-specific SE. d, Plot shows SA1 and SA2 enrichment in HMEC and HCAEC cells along HMEC SE. e, Boxplot comparing changes in expression between random genes and genes associated with HMEC-specific SE32. Boxes represent interquartile range (IQR), midline represent the median, whiskers are 1.5xIQR and individual points are outliers. Statistical significance was calculated with a Wilcoxon signed-rank test.

