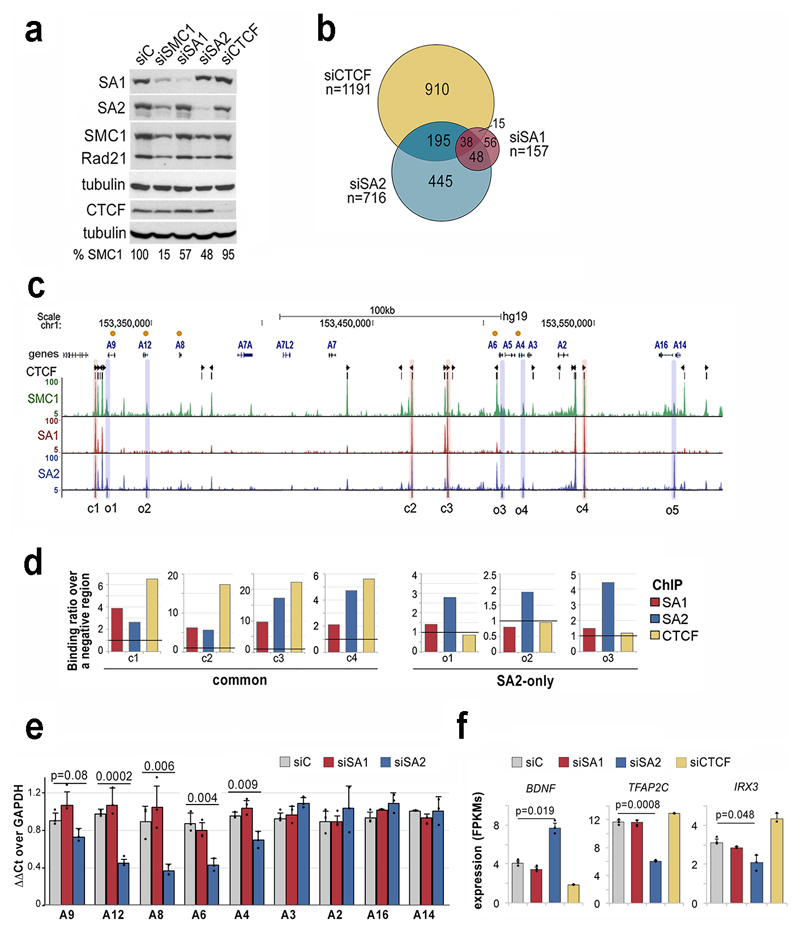
Fig. 3. SA2-specific changes in transcription are related to cell identity.
a, Levels of cohesin and CTCF after siRNA transfection in MCF10A cells (uncropped blot images are shown in Supplementary Dataset 1). b, Venn diagram showing the overlap between genes deregulated after downregulation of SA1, SA2 or CTCF compared to mock transfected cells (FDR<0.05, log2fold change<-0.5 or >0.5 and FPKM>3 in at least one condition). b, UCSC browser image of the S100A gene cluster showing genes (orange dots indicate those deregulated in SA2 depleted cells), CTCF peaks (and motif orientation), and genomic distribution of SMC1, SA1 and SA2 in MCF10A cells. Positions corresponding to common (c) and SA2-only (o) cohesin binding sites used in ChIP-qPCR analyses are shadowed in red and blue, respectively. d, ChIP-qPCR validation of SA1, SA2 and CTCF binding to (c) and (o) positions. e-f, Gene expression levels of S100A genes (e) and cell-type specific transcription factors (f) in control, siSA1, siSA2 and siCTCF conditions (mean and SD from three independent experiments). Student's T test was used to assess statistical significance.

