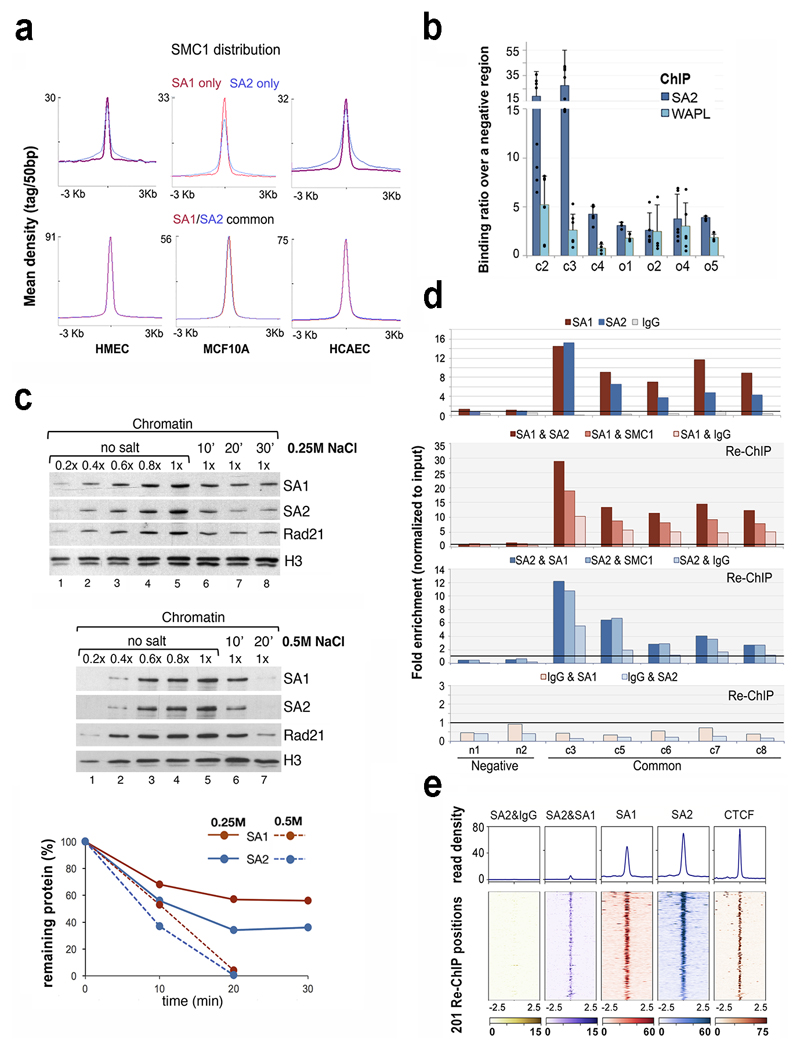
Fig. 4. Different behaviour of cohesin in common and SA2-only positions.
a, Cohesin SMC1 distribution in HMECs, MCF10A and HCAECs. Maximum mean tag density is indicated on the Y axis. b, SA2 and WAPL binding to the indicated cohesin positions from the S100 locus. Bars represent the mean of at least three independent experiments performed in triplicates; error bar=SD. c, Chromatin bound cohesin was determined upon 0.25M (mid panel) and 0.5M (lower panel) NaCl treatment at different time points. Quantification is shown at the bottom. Uncropped blot images are shown in Supplementary Dataset 1. d-e, The simultaneous presence of at least two cohesin complexes at a given position within the same cell was assayed by Re-ChIP-qPCR (d), and confirmed by Re-ChIP-seq (e). Chromatin eluted from the first ChIP with SA1 or SA2 was incubated with SA2 and SA1 antibodies, respectively, as well as SMC1 and IgG as positive and negative controls. Lower panel, Re-ChIP of chromatin eluted from IgG beads with SA1 and SA2. Positions c3-c8 are "common" cohesin binding sites; n1 and n2, are negative regions. All the positions captured by Re-ChIP-seq (e) correspond to common sites in MCF10A cells.

