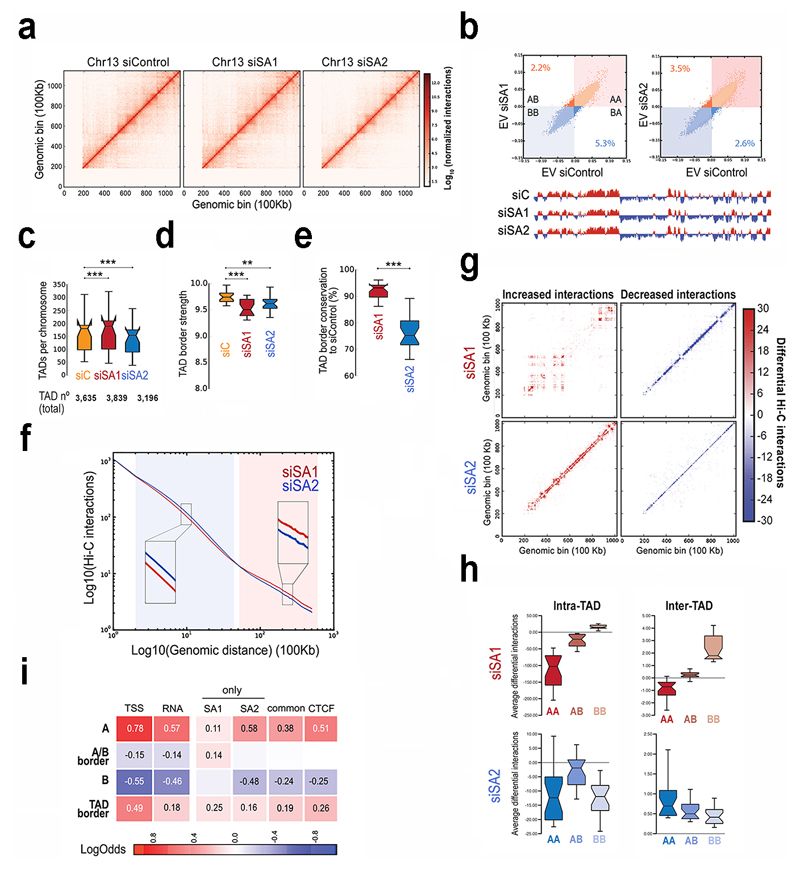
Fig. 6. Distinct contribution of cohesin-SA1 and cohesin-SA2 to genome architecture.
a, Vanilla normalized Hi-C matrices for chr13 at 100Kb resolution in MCF10A cells. b, Scatter plot of eigenvectors of the intra-chromosomal interaction matrices indicated. Numbers within the plot show the % of bins that change compartment. First eigenvector for chr13 at 100Kb resolution is shown below. c-e, Boxplots showing number of TADs per chromosome (c), TAD border strength (d) and TAD border conservation (e). The box extends from the lower to upper quartile values of the data, with a line at the median. Notches represent the confidence interval around the median. f, Hi-C interactions as a function of genomic distance averaged across the genome for a maximum distance of 50 Mb. g, Overall genome-wide increased and decreased interactions between siControl and siSA1 or siSA2 in chr15. h, Effect of the SA1 or SA2 depletion in differential inter- and intra-TAD interactions in different compartments. Boxplots are for the chromosome average values. i, Enrichment of SA1-only, SA2-only and common sites in AB compartments, A/B borders and TAD borders. Squares with numbers are significant (Fisher exact test, p-values < 0.001).

