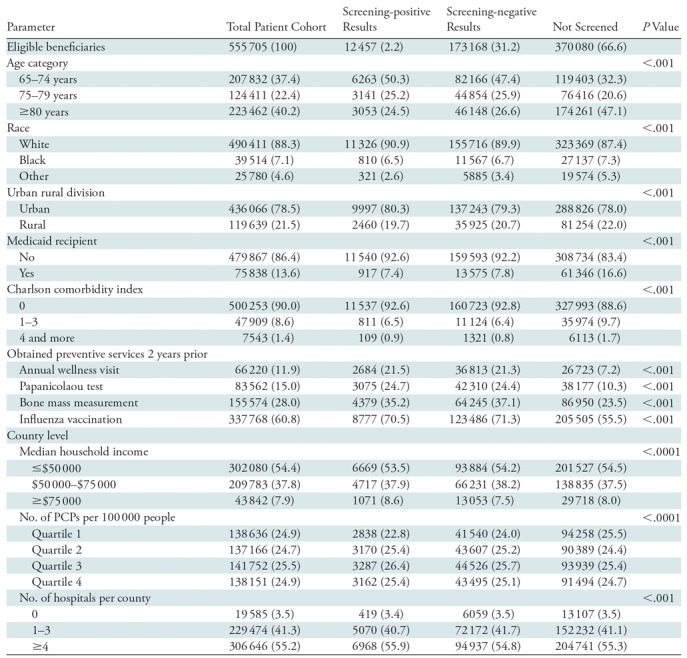
Table 1:
Descriptive Statistics of the Study Sample

Note.—Unless otherwise indicated, data are number of patients; data in parentheses are percentages. P values are for comparison of means across screening positive, screening negative, and not screened groups. PCP = primary care providers.
