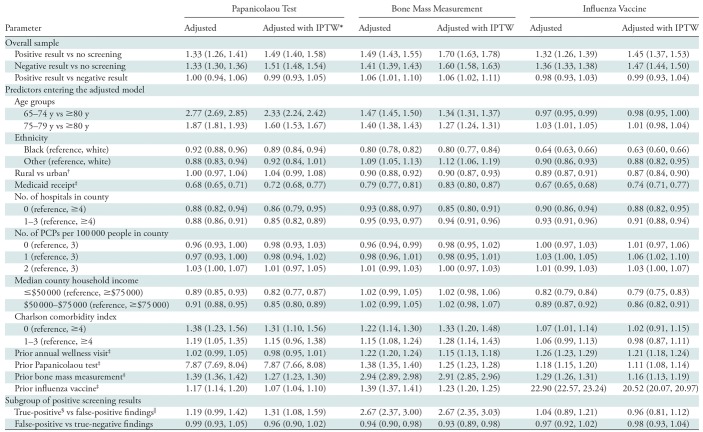
Table 2:
Adjusted Odds Ratio Estimates with Model Selection
Note.—Data are odds ratios; data in parentheses are 95% confidence intervals. IPTW = inverse probability of treatment weighting using propensity score, PCP = primary care providers.
*Model was adjusted by using multivariable regression and inverse probability of treatment weighting.
†Because of sample size limitation, geographic division variable instead of state was used in the subgroup analysis.
‡Indicated variables are binary (ie, yes vs no).
§True-positive findings were defined as positive findings at screening and a breast cancer diagnosis within 1 year after the index screen; true-negative findings at screening did not result in breast cancer diagnosis within the next year.
||False-positive findings were defined as positive findings at screening and no breast cancer diagnosis within 1 year after the index screen.

