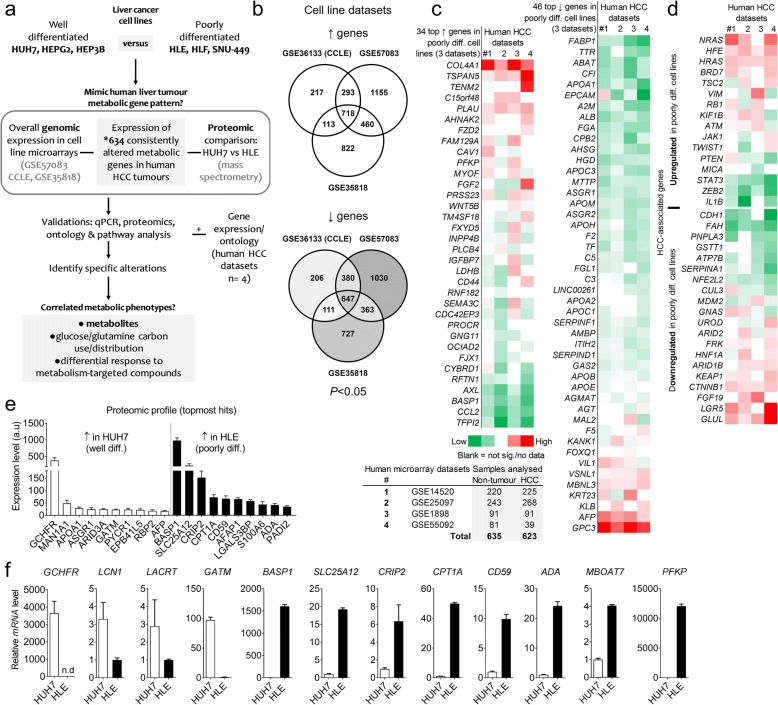
Fig. 1.
Molecular characterization of the resemblance between HCC cell lines and human liver tumours. a Workflow of analyses to unravel the metabolic profiles of HCC cell lines. *published list of metabolic genes consistently deregulated in 6–8 human HCC microarray datasets [13]. b Venn diagram showing the number of differentially expressed genes in poorly differentiated cell lines (HLE, HLF, SNU-449) relative to well-differentiated cell lines (HUH7, HEPG2, HEP3B), in three cell line microarray datasets (P < 0.05). c Heatmap showing genes within the top 100 upregulated or downregulated in all three cell line datasets, GSE36133, GSE35818, and GSE57083 (adjusted P < 0.0001) and their expression pattern in patients datasets (P < 0.05). Below are four human HCC datasets used for assessing resemblance with the cell line profile. The genes were ranked based on their average z-score in the human datasets. Diff. – differentiated. d Heatmap showing 36 HCC-associated genes differentially expressed in the poorly differentiated cell lines (P < 0.05 at least in one cell line dataset), and their expression pattern (z-score ranked) in patients datasets . Red – upregulated; green – downregulated; blank – not significant or no data available. e Top 10 proteins distinctly expressed in the representative well (HUH7) and poorly differentiated cell line (HLE). ≥2 peptides were detected by mass spectrometry for the indicated proteins, FDR adjusted P < 0.0001. Bars show mean ± SD of the expression of each protein in one of the cell lines compared to the other. Replicate samples n = 7 for HUH7 and 8 for HLE cells: a.u – arbitrary unit. f Quantitative PCR validation of a panel of genes derived from the topmost altered candidates in cell line datasets and or proteomics data. Bars show mean ± SD of triplicate samples

