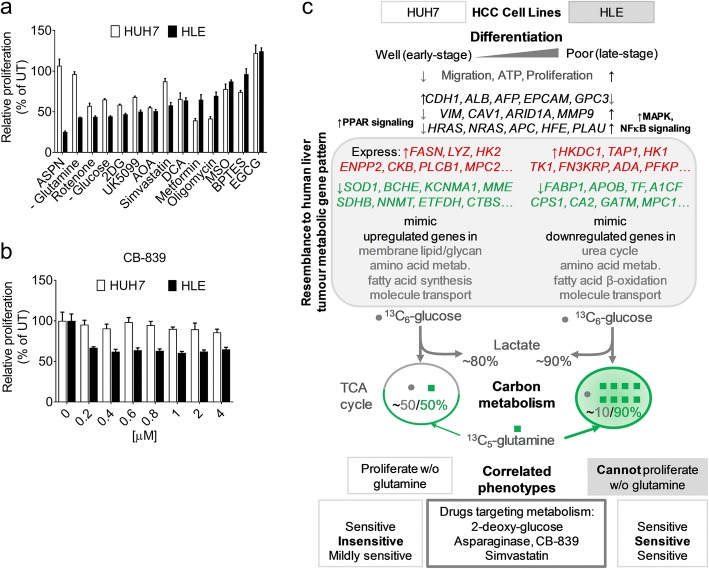
Fig. 5.
Phenotypic response to metabolic perturbation in HCC cell lines representing opposite tumour differentiation grades. a MTT proliferation assay showing response of the HCC cells to metabolism-targeting compounds or glucose/glutamine deprivation. ASPN – Asparaginase (0.5 U), Rotenone (0.25 μM), 2DG – 2-deoxy-glucose (5 mM), UK5099 (10 μM), AOA – Aminooxyacetate (1 mM), Simvastatin (2.5 mM), DCA –Dichloroacetate (5 mM), Metformin (5 mM), Oligomycin (1 μM), MSO – Methionine sulfoximine (2 mM), BPTES (5 μM) and EGCG (50 μM). Duration of treatment or deprivation is 48 h, except ASPN (72 h) and the cells were treated in parallel, each normalized to its untreated/control group. Bars indicate mean ± SD, and representative of at least 2 experimental observations (n = 4 per group). b MTT proliferation assay showing a selective antiproliferative effect of CB-839 (glutaminase inhibitor) on HLE cells over 48 h (n = 4 per group). CM – complete medium; UT – untreated, MTT – 3-(4,5-dimethylthiazol-2-yl)-2,5-diphenyltetrazolium bromide. c A scheme summarizing the differentiation status of HCC cell lines, examples of human HCC tissue-derived metabolic genes mimicked by the respective cell lines, the accompanying metabolomics profile, and differential response to metabolic perturbation. w/o – without: refers to extracellular glutamine

