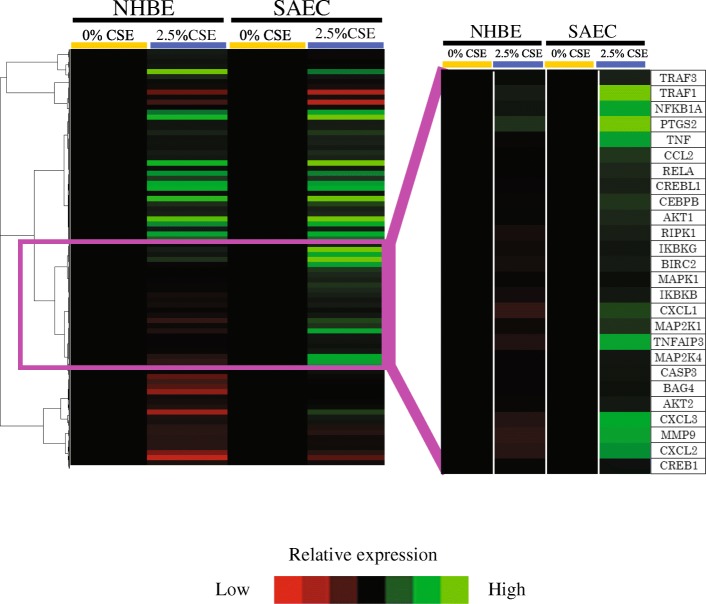
Fig. 2.
Hierarchical clustering analysis of the TNF-signaling pathway. SAECs and NHBEs were exposed to 2.5% CSE for 24 h or not (controls). Two different batches of SAECs and NHBEs were used. The specific cluster containing genes upregulated by CSE exposure predominantly in SAECs is highlighted (right). High relative expression is indicated in green, and low relative expression is indicated in red. CSE, cigarette smoke extract; SAECs, small airway epithelial cells; NHBEs, normal human bronchial epithelial cells.

