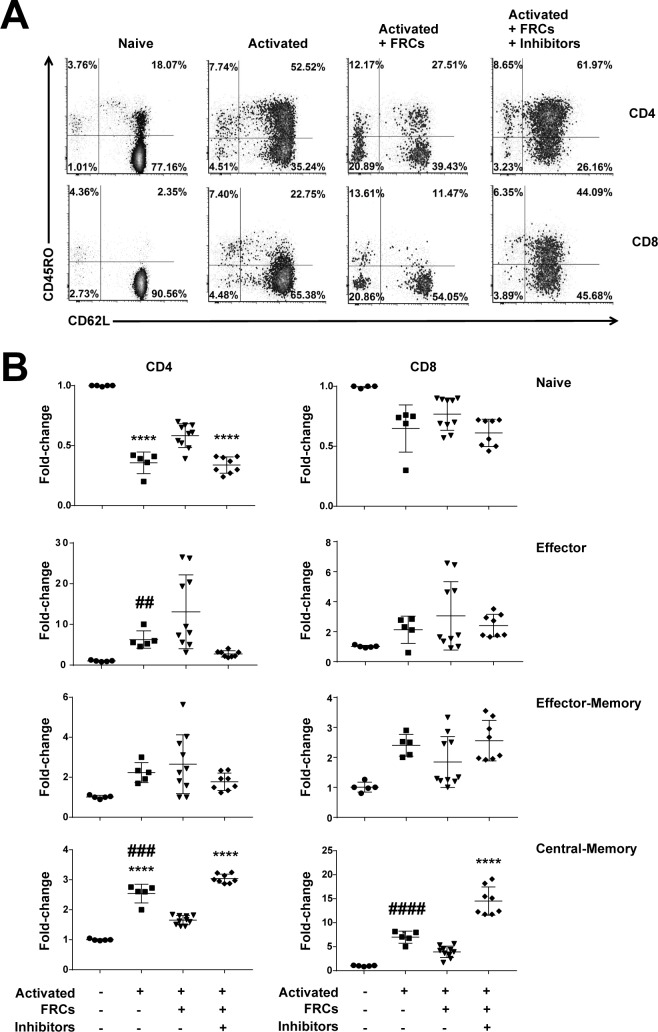
Fig 3. FRCs constrain differentiation of T cells with a central memory phenotype.
A. CFSE-labelled PBMCs (5 × 10⁵) were stimulated with anti-CD3/CD28/CD2-coated beads, with or without precultured FRCs, and in the presence or absence of the inhibitor cocktail. Some wells were left unstimulated. After 96 h, cells were harvested and analysed by flow cytometry. Plots gated for CD3, CD4, or CD8; CD62L; and CD45RO. Figure is representative of 3 FRC donors and 3 PBMC donors from a total of 3 independent experiments. B. Fold-change analysis of FRC effect on T-cell differentiation from experiments conducted as described in A. A star (*) defines significance compared to untreated; a hash (#) defines significance compared to activated+FRCs+inhibitors. Two symbols refers to P < 0.01; 3 symbols to P < 0.001; 4 symbols to P < 0.0001, using a 1-way ANOVA with Sidak’s multiple comparisons test. Data depict 3 independent experiments, each with 2–4 FRC donors and 1 PBMC donor. Data used in the generation of this figure can be found in S1 Data. FRC, fibroblastic reticular cell; PBMC, peripheral blood mononuclear cell.

