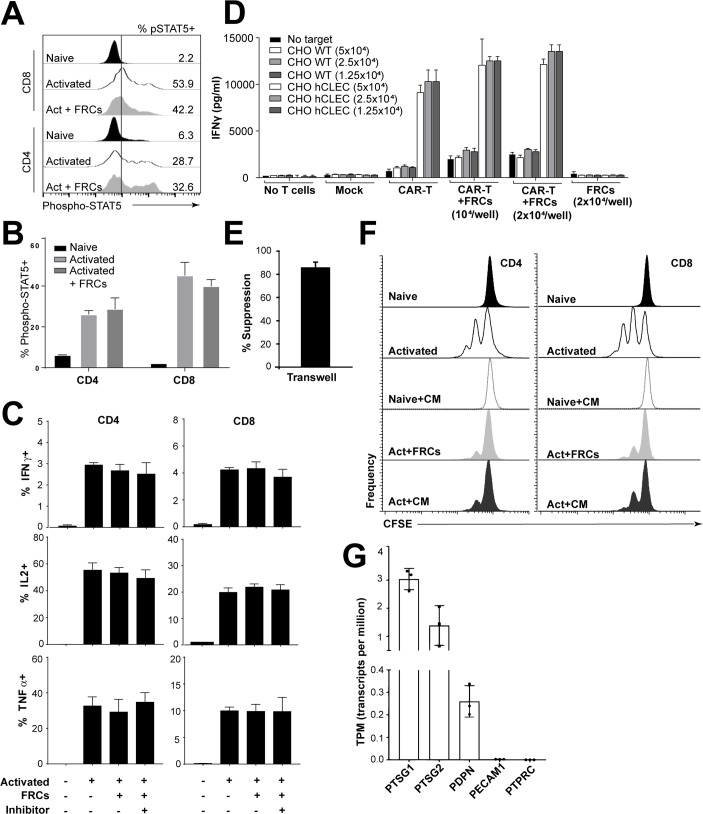
Fig 4. FRCs act unilaterally to suppress T cells.
A, B. PBMCs (5 × 10⁵) were stimulated with anti-CD3/CD28/CD2-coated beads with or without precultured FRCs and in the presence or absence of the inhibitor cocktail for 48 h. Cells were then washed to remove stimulant and allowed to rest for 24 h before anti-CD3/CD28/CD2-coated bead reactivation for 15 min. Cells were then harvested and stained for pSTAT5 using the PhosFlow kit according to the manufacturer’s instructions. A depicts histograms gated on CD3+ T cells. B depicts aggregate data from 1 experiment of N = 1 PBMC donor and N = 2 FRC donors; error bars depict SD. Data are representative of N = 4 FRC donors and N = 2 PBMC donors from 2 independent experiments. C. PBMCs (5 × 10⁵) were stimulated by anti-CD3/CD28/CD2-coated beads with or without precultured FRCs and in the presence or absence of the inhibitor cocktail for 96 h. Brefeldin A was added for the last 4 h of activation. Cells were harvested; stained for IFNγ, IL-2, or TNFα; and analysed by flow cytometry. Bar graphs depict N = 3 FRC donors and N = 1 PBMC donor. Data represent 2 independent experiments. Mean and SD depicted. D. Mock-transduced or transduced CART cells were stimulated with target CHO cells expressing antigen (hCLEC) or irrelevant protein (WT), in the presence or absence of FRCs at 2 dilutions. FRCs alone or no T-cell groups were negative controls. Eighteen h after coculture, IFNγ concentration was tested using ELISA. Data represent N = 2 independent experiments. E. FRCs were cultured in 24-well plates for 24 h prior to introduction of CFSE-labelled T cells in a transwell. After 48 h of activation with anti-CD3/CD28/CD2-coated beads, T cells were harvested, and percent suppression was assessed by flow cytometry by taking the ratio of percent T cells divided in the presence of a 1 μm transwell, divided by the percent divided in the absence of the transwell × 100. Mean and SD depicted from N = 2 FRC donors and 2 PBMC donors from 2 independent experiments. F. CFSE-labelled PBMCs were stimulated with anti-CD3/CD28/CD2-coated beads, with or without precultured FRCs. Some wells were left unstimulated, and some stimulated wells had a 1:2 dilution of FRC CM added. After 96 h, cells were harvested and analysed by flow cytometry. Plots gated on CD3, CD4, or CD8 and CFSE. Data are representative of N = 4 FRC donors and N = 2 PBMC donors from 2 independent experiments. CM was derived from N = 2 FRC donors, each used in 2 independent experiments. G. RNA-Seq data from cultured (passage 3) human tonsil–derived FRCs. N = 3 unrelated FRC donors. Y axis represents normalised expression of genes in transcripts per million. Data used in the generation of this figure can be found in S1 Data. CAR, chimeric antigen receptor; CHO, Chinese hamster ovary; CM, conditioned medium; FRC, fibroblastic reticular cell; hCLEC, human C-type lectin domain family 14 member A; IFNγ, interferon gamma; IL-2, interleukin 2; PDPN, podoplanin; PECAM1, platelet and endothelial cell adhesion molecule 1; PBMC, peripheral blood mononuclear cell; pSTAT5, phosphorylated signal transducer and activator of transcription 5; PTPRC, protein tyrosine phosphatase receptor type C; PTSG1, prostaglandin-endoperoxide synthase 1; PTSG2, prostaglandin-endoperoxide synthase 2; RNA-seq, RNA sequencing; TNFα, tumour necrosis factor alpha; WT, wild type.

