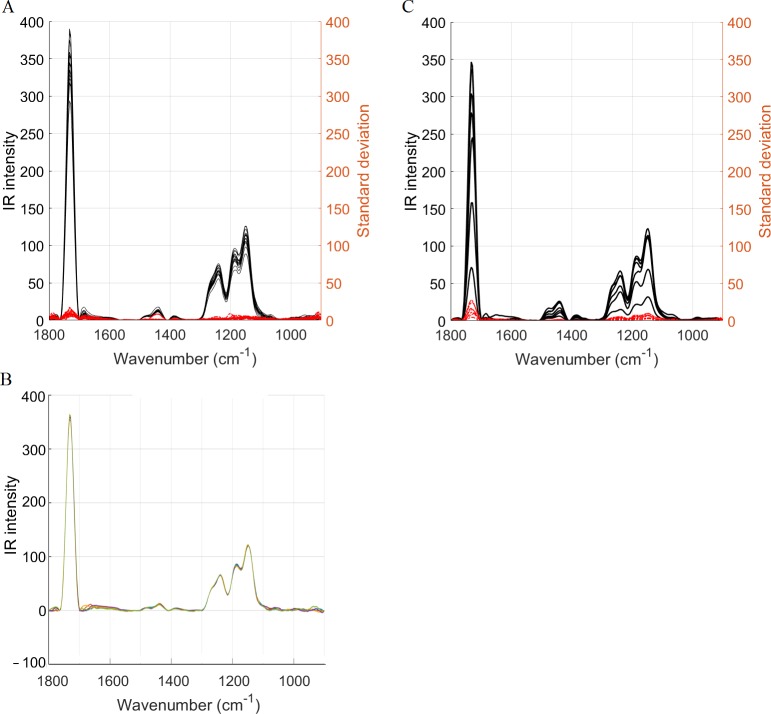
Fig 2. Temporal and spatial reproducibility.
(A) The temporal reproducibility was assessed on PMMA (n = 7). The 5 repeated measurements for each of the 16 locations were averaged (black) and the corresponding standard deviation was derived for each location (red). The low standard deviation validates a good temporal reproducibility. (B) Example of a group of five repeated measurements showing a good temporal reproducibility. (C) The spatial reproducibility was assessed on seven samples. The 16 spectra (locations) per sample were averaged (black) and the corresponding standard deviation was derived (red). The low standard deviation validates a good spatial reproducibility.

