
Fig 4. AFM-IR images show a non-mineralized layer (osteoid) not observed with FTIR.
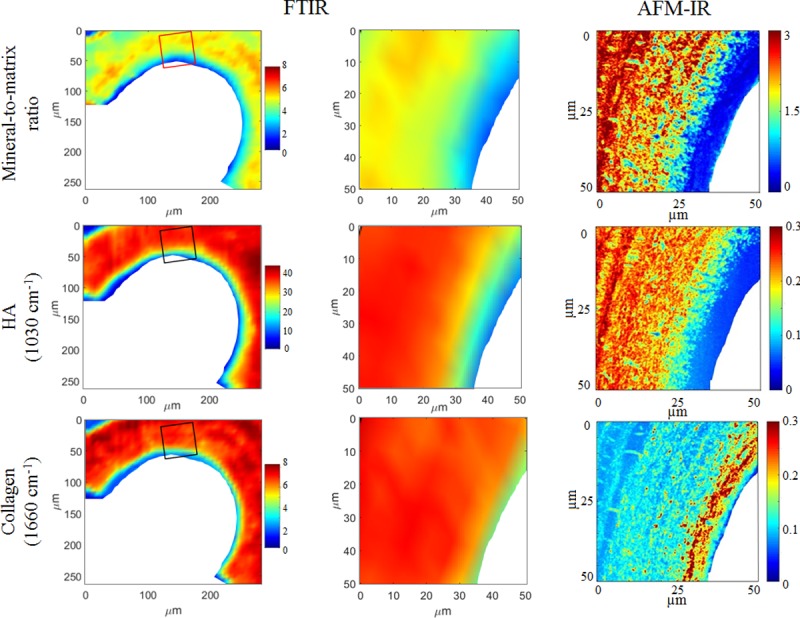
Images acquired on the same cancellous bone samples with AFM-IR (right column) and FTIR (left and middle columns). The images in the left column were acquired with FTIR; the rectangles indicate the areas where the corresponding AFM-IR images were acquired. The FTIR images obtained within the rectangular area are enlarged in the middle column to match the size of the AFM-IR images, shown in the right column. The first row is the mineral-to-matrix ratio, the second row shows maps of the hydroxyapatite crystals acquired at 1030 cm-1, and the third row shows maps of the collagen acquired at 1660 cm-1. Color scales indicate the relative IR intensity for the technique used (left and middle columns share the same color scales).