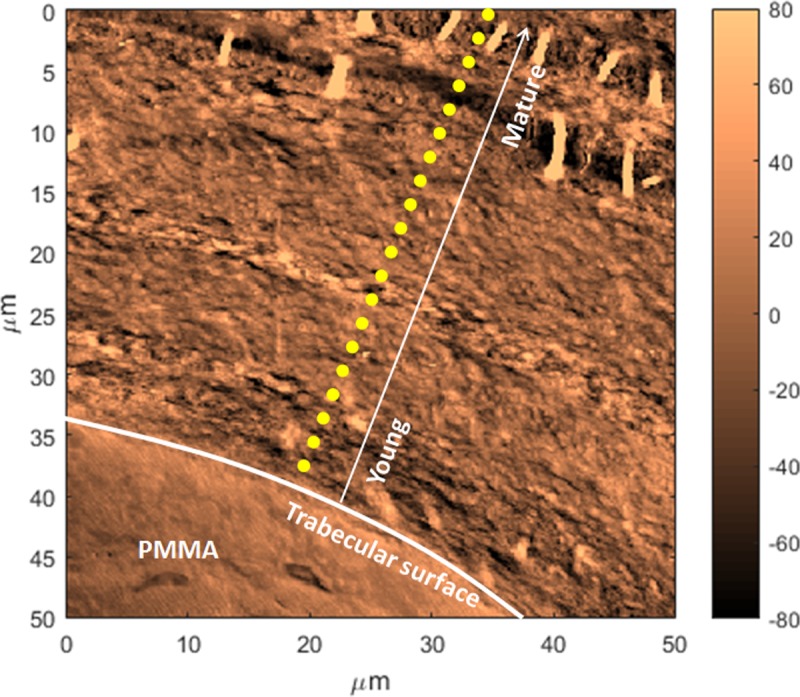
Fig 5. AFM image showing a line scan acquisition.

Example of line scan measurements (yellow dotted line) performed from the trabecular surface where the bone tissue is the youngest (the white arrow represents increasing tissue age from the surface), to the interior where the bone tissue is more mature. An ultrastructure is evident with layers of different orientations. Also fibers are visible at the interior, possibly mineralized fibers that appeared when the section was cut and deposited onto the substrate.
