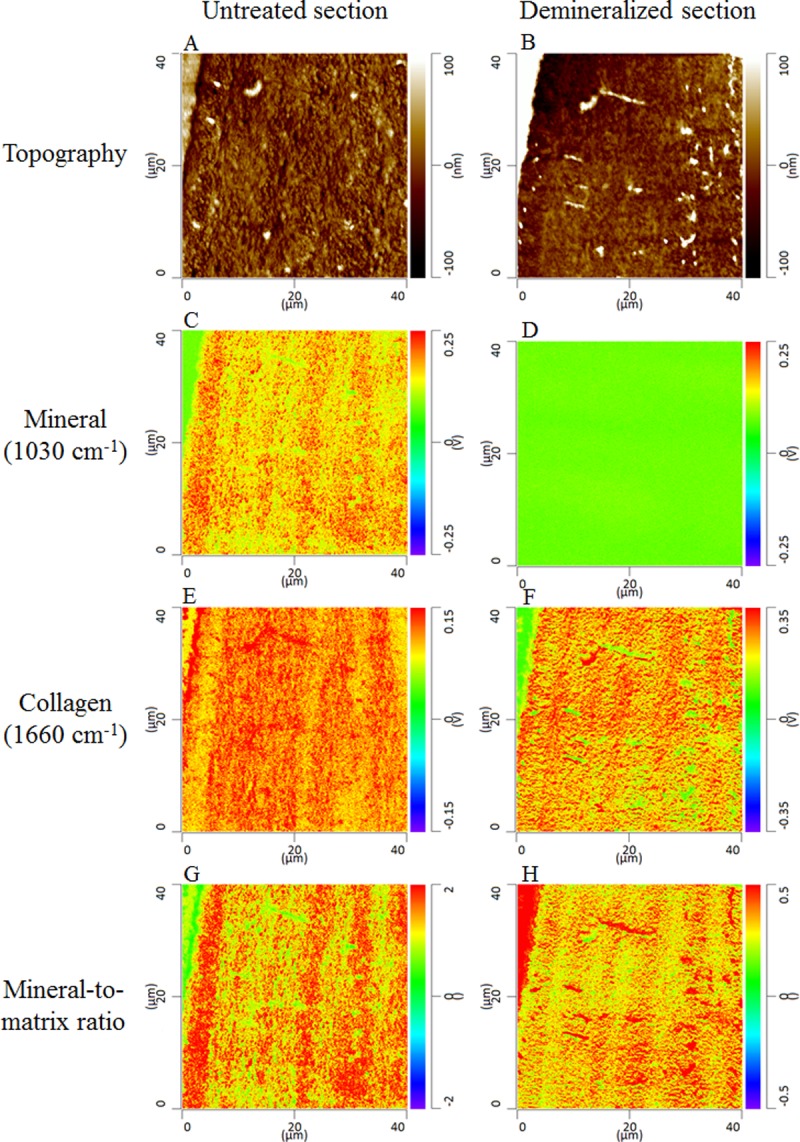
Fig 9. Height and infrared intensities acquired on a cancellous bone thin section (300 nm) before and after demineralization of the section using EDTA.

The topographic images (A and B) were acquired with the AFM in contact mode. The mineral (C and D) and collagen (E and F) images were acquired by AFM-IR at wavenumbers 1030 cm-1 and 1660 cm-1, respectively. The ratio of these two images is the mineral-to-matrix ratio (G and H). Before EDTA treatment the images had an alternating (layered or striated) pattern when both mineral and collagen were present in the section. The two components are entangled, and individual contributions cannot be distinguished. To uncouple the contributions, the collagen component was isolated by dissolving the mineral crystals. After EDTA treatment, the mineral image (D) shows a null intensity, indicating that the demineralization was accomplished. In the collagen image after demineralization (F) an alternating pattern still exists in the absence of mineral, suggesting that the collagen (either structure or density) is a significant contributor to the periodic pattern although the collagen structure may be affected by the mineral dissolution. The collagen pattern is also reflected in the mineral-to-matrix image.
