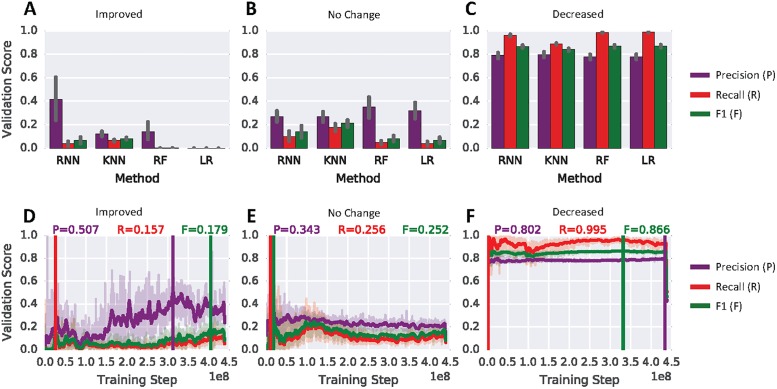
Fig 3. RNN performance comparison.
(A)–(C) Comparison of validation-set performance for the 3 different states improved, no-change and decreased. Shown are the recurrent neural network (RNN) against k-nearest neighbours (KNN), random forest (RF) and logistic regression (LR) on the full cross-validation sets. The shown performance is the mean value of all seven validation sets. The error bars indicate the standard deviation computed from all 7 folds. (D)-(E) Classification precision, recall and F1 as a function of training steps for the three different states. Shown is the training progress for CV fold 4. The vertical lines indicate the best performance for each metric based on a moving average with a window-size of 30.

