Fig 5.
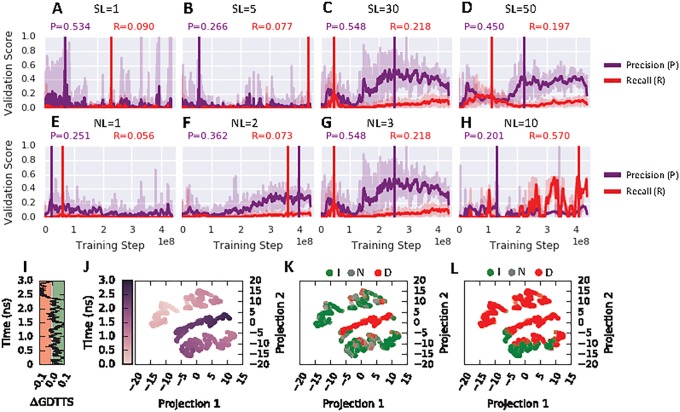
(A)–(D) Effect of sequence length (SL) 1, 5, 30 and 50 on precision and recall for the improved state class as a function of training steps tested on validation fold 4. (E)–(H) Effect of number of hidden layers (NL) with values 1, 2, 3 and 10 on precision and recall for the improved state class as a function of training steps tested on the 4th validation fold. The vertical lines indicate the best performance based on a moving average with a window-size of 30. (I) Trajectory trace of target TR821, the ΔGDTTS is shown as a function of its 3 ns simulation time. Sampling of the green colored regions indicate an improved state, grey regions a no-change state and red a decreased state. Visualizations of the last hidden layer where the data-points are colored by (J) time, (K) ground truth and (L) predicted labels. The 1024-dimensional last hidden layer was projected to 2-dimensions with t-SNE.

