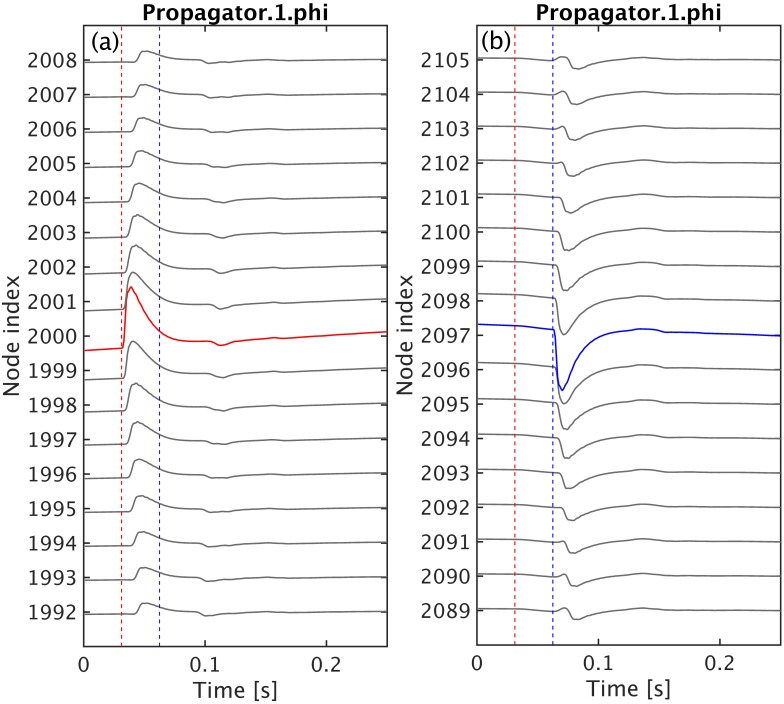
Fig 8. Timeseries of neural activity of the model described in e-erps.conf.
The cortical population is driven by two temporal square pulses applied at the center of the grid as shown in Fig 7. Here, we illustrate the timeseries of ϕee from a few nodes close to the vicinity of (gray lines) and at the stimulation sites. The vertical dashed lines mark the onset time of the positive (red dashed) and negative (blue dashed) stimulation inputs, respectively. (a) the axonal field at the site receiving the positive stimulus is highlighted in red while the time evolution of the same axonal field at neighbouring locations is shown as gray lines. (b) the axonal field at the site receiving the negative input is highlighted in blue.

