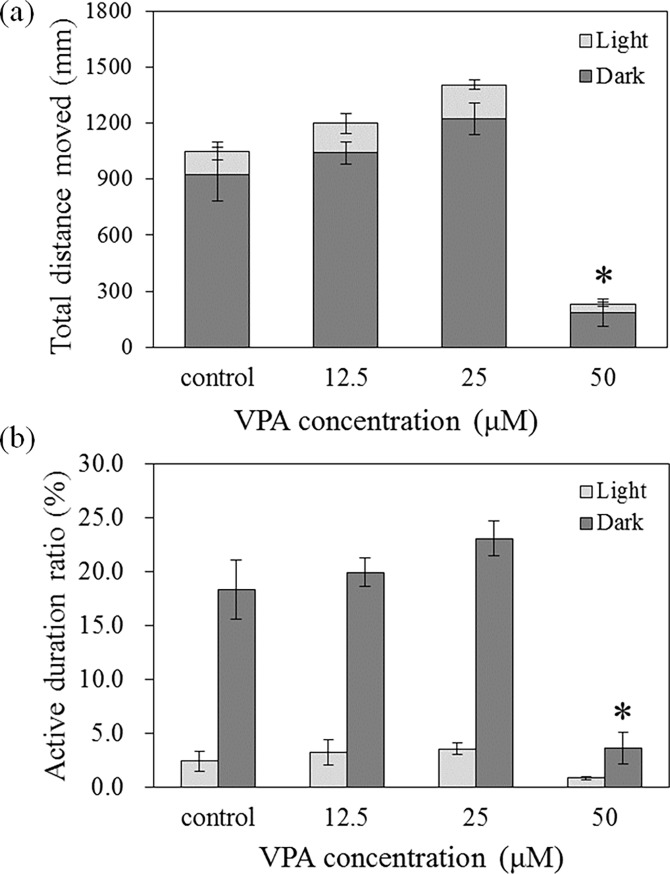
Fig 2.
Total distance moved (a) and active duration ratio (b) after 120 h VPA exposure. The error bars are marked separately for the dark and light phases. The analysis the total distance moved was determined for the sum of the distance moved during the dark and light phases. The results are shown as the mean ± SEM (N = 8, except control (N = 7)). Asterisks (*) indicate statistical significance (p < 0.05).

