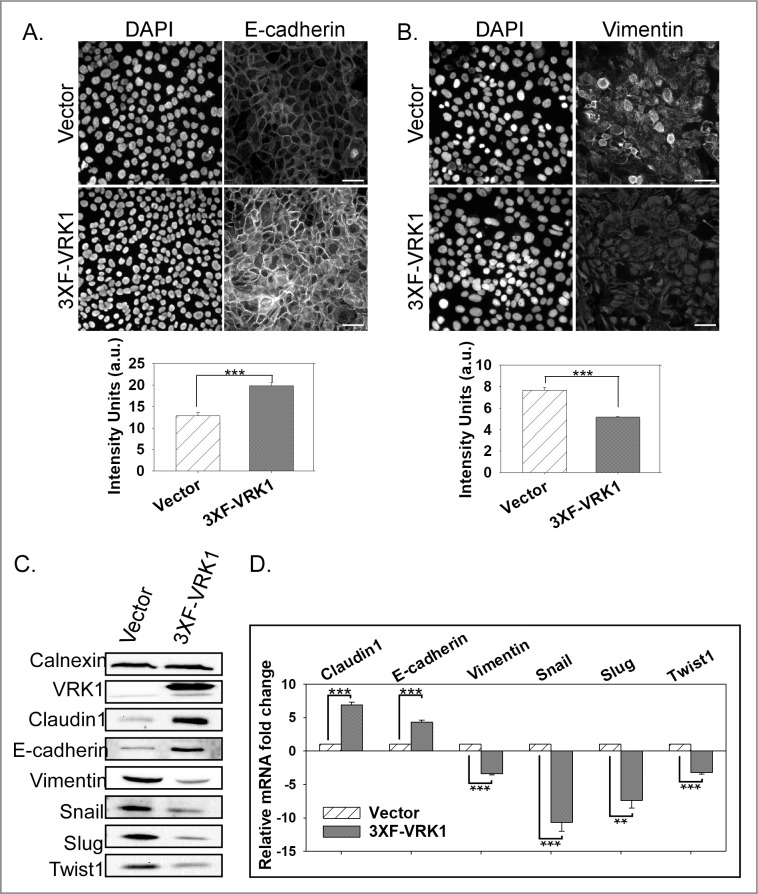
Fig 4. VRK1 overexpression augments the epithelial properties of MCF10A cells.
(A and B) Immunofluorescence analysis of E-Cadherin (A) and vimentin (B) in control and 3XF-VRK1-overexpressing MCF10a cells. Representative images of E-cadherin and vimentin staining are shown in top panels. Scale bar = 100μm. Quantitation of the E-cadherin and vimentin staining intensity from 6 different random fields is shown in bottom panel (mean and standard error shown; ***p<0.001). (C) Immunoblot analysis of control and 3XF-VRK1 overexpressing MCF10A cells. A representative immunoblot is shown (n = 4). (D) Quantification of the levels of claudin-1, E-cadherin, vimentin, snail, slug, and twist1 mRNAs by qRT-PCR analysis. Grouped bar graph displays the mRNA fold changes observed in VRK1-overexpressing vs. control cells (mean and standard error shown; **p<0.01, and ***p<0.001) (n = 3).

