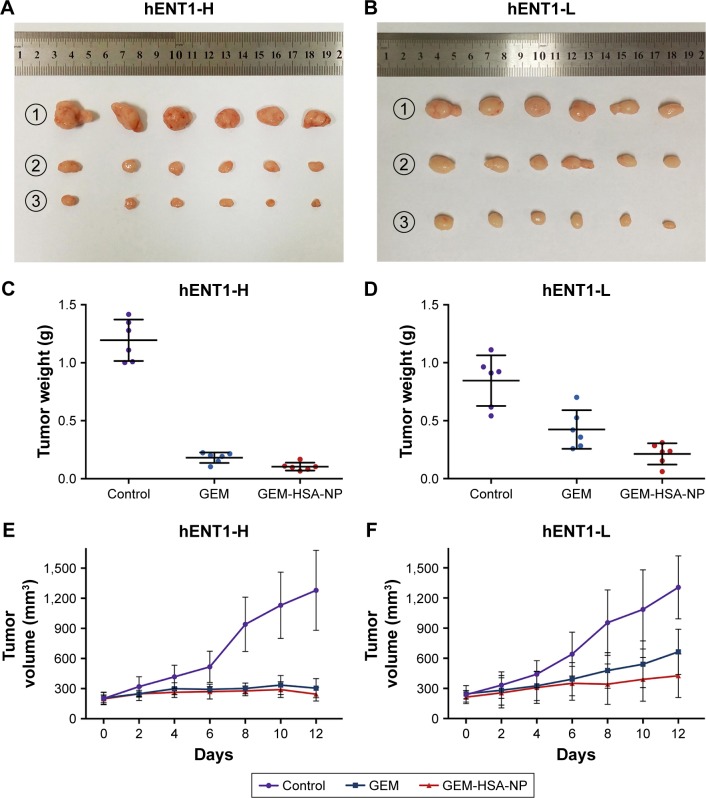
Figure 5.
Tumor weights and volume profiles in hENT1-H and hENT1-L group.
Notes: (A) Tumors harvested from each subgroup after different treatments in the hENT1-H group. (B) Tumors harvested from each subgroup after different treatments in the hENT1-L group. (C) Tumor weights of each subgroup in the hENT1-H group. (D) Tumor weights of each subgroup in the hENT1-L group. (E) Tumor volume profiles of mice treated with NS, GEM and GEM-HSA-NP in the hENT1-H group. (F) Tumor volume profiles of mice treated with NS, GEM and GEM-HSA-NP in the hENT1-L group. NS was used as control. ①, ② and ③ represent NS, GEM and GEM-HSA-NP, respectively.
Abbreviations: GEM, gemcitabine; GEM-HSA-NP, gemcitabine-loaded human serum albumin nanoparticle; NS, normal saline; hENT1-H, high hENT1 expression; hENT1-L, low hENT1 expression.

