Figure 4.
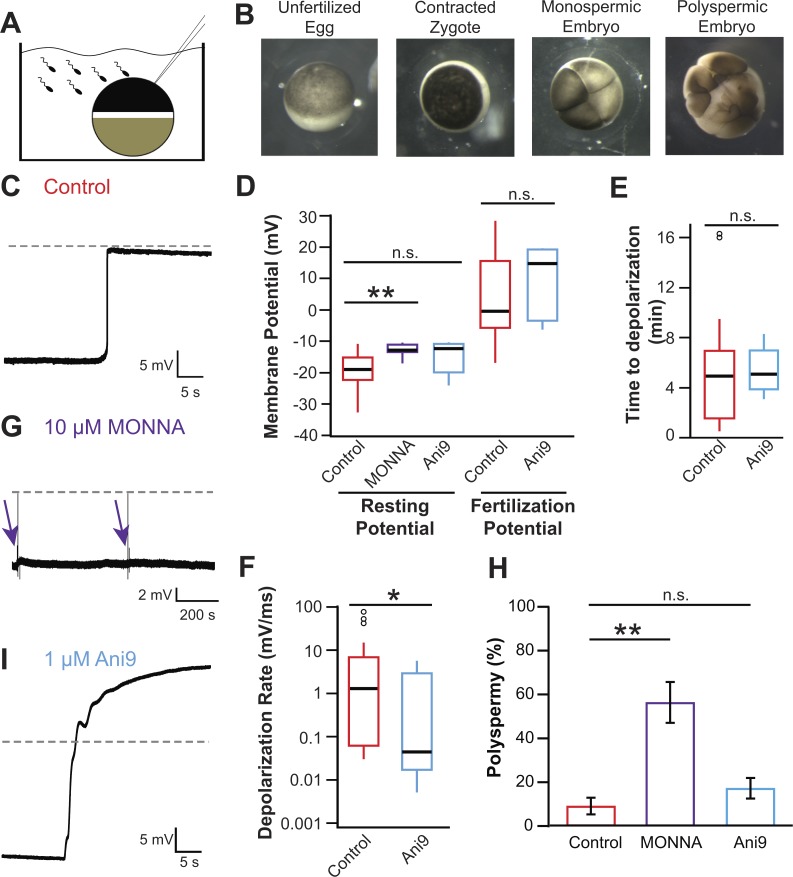
Fertilization activates TMEM16A to depolarize the egg. (A) Schematic depiction of experimental design showing whole-cell recordings made on X. laevis eggs during fertilization. (B) Images of an X. laevis egg before sperm addition (left), an egg ∼15 min after fertilization with animal pole contracted (center left), a monospermic embryo (center right), and a polyspermic embryo (right). (C, G, and I) Representative whole-cell recordings made during fertilization in control conditions (C), the presence of 10 µM MONNA (G), or the presence of 1 µM Ani9 (I). Dashed lines denote 0 mV, and arrows denote times at which sperm was applied to eggs in the presence of 10 µM MONNA. (D–F) Tukey box plot distributions of the resting and fertilization potentials in control conditions and with MONNA or Ani9 (D), the time between sperm application and depolarization in the absence and presence of Ani9 (E), and the depolarization rate in the absence and presence of Ani9 (F; n = 5–30, recorded over 2–16 experimental days per treatment). The central line represents the median value, and the box denotes the data spread from 25–75%, and the whiskers reflect 10–90%. (H) Proportion of polyspermic embryos out of total developed embryos in control, MONNA, and Ani9 (n = 3, recorded over three experiment days per treatment). n.s., P > 0.05; *, P < 0.05; **, P < 0.001.

